Wireshark Basics
Introduction
This article will be covering Wireshark including the following topics:
- Getting Wireshark
- Software overview
- Basic filtering
- Example usage
What is Wireshark
Wireshark is a network packet analyzer. It is used to capture data from a network and display its content. Being an analyzer, Wireshark can only be used to measure data but not manipulate or send it. Wireshark is open source and free which makes it one of the most popular network analyzer available.
Getting Wireshark
Wireshark is available for Linux, Windows and Mac through the official website. For more information about building Wireshark from source please take a look at the official developers guide.
Running Wireshark
Depending on your operating system and user settings you might have to run Wireshark with admin privileges to capture packets on your network. If your welcome screen is blank and does not show any network interfaces it usually means that your user account is lacking the necessary access rights.
Your First Capture
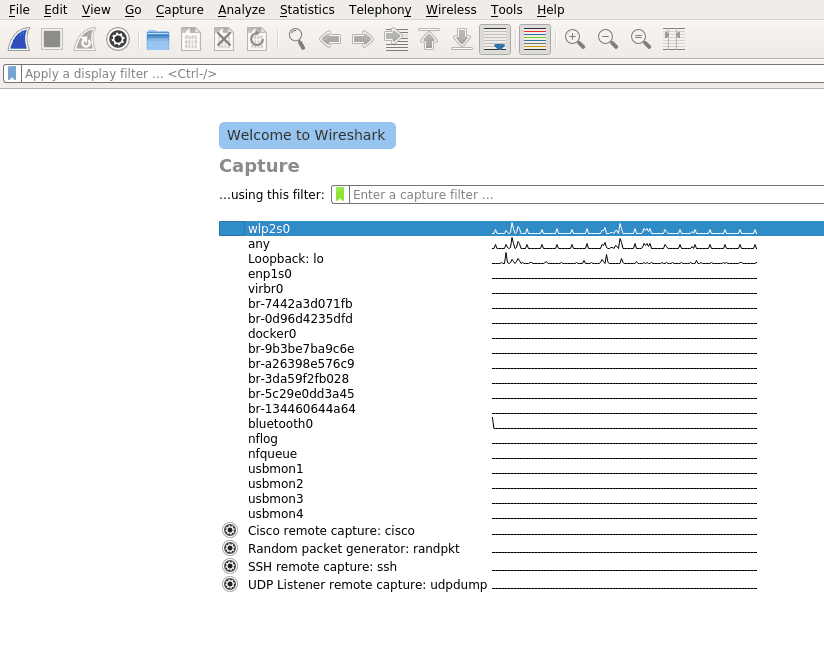
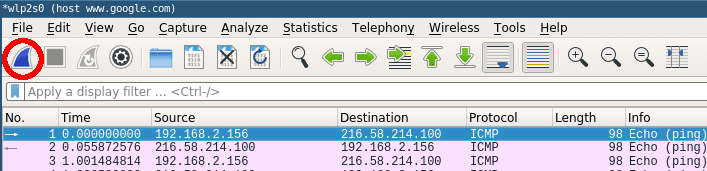
Once Wireshark is started you will be greeted by a welcome screen like the one shown above listing all available network connections. A small traffic preview is shown next to the interface names so it is easy to distinguish between interfaces with or without direct network access. To finally start capturing data on your network you first have to select one or more of these network interfaces by simply clicking on them. To select multiple interfaces at once just hold down ctrl and select all interfaces you want to listen on. Once selected you can start recording packets by clicking the start icon in the top left of the user interface.
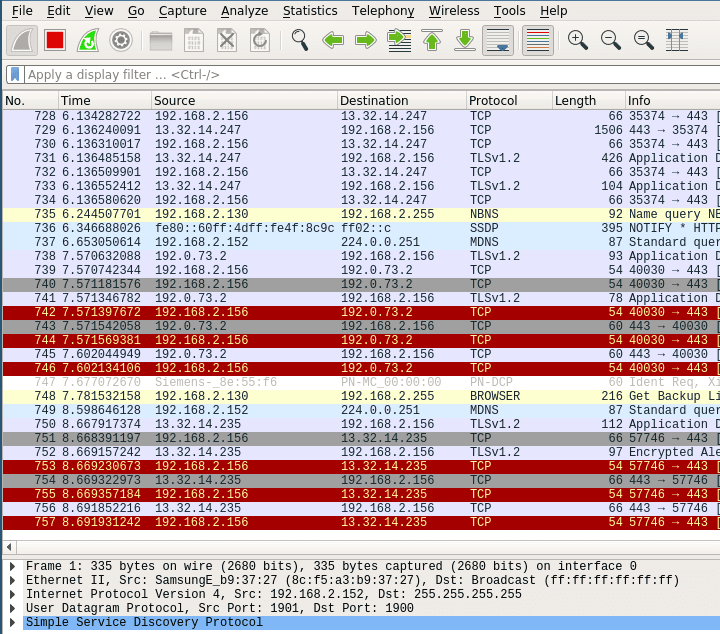
The window will change to the main capturing view and immediately display everything passing the network on your selected capturing device as see below.
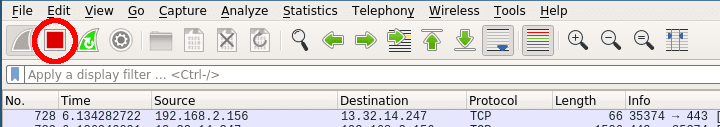
Stop the current capturing process by clicking on the red stop button.
Filtering Traffic
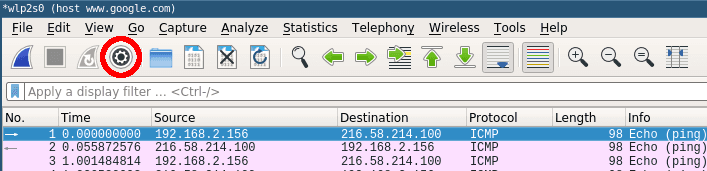
Even the smallest network will produce a lot of static data that can result in very large capture files. To avoid slowdowns you should not capture unfiltered network traffic. To do so open the capture configuration window by clicking on the cogwheel icon.
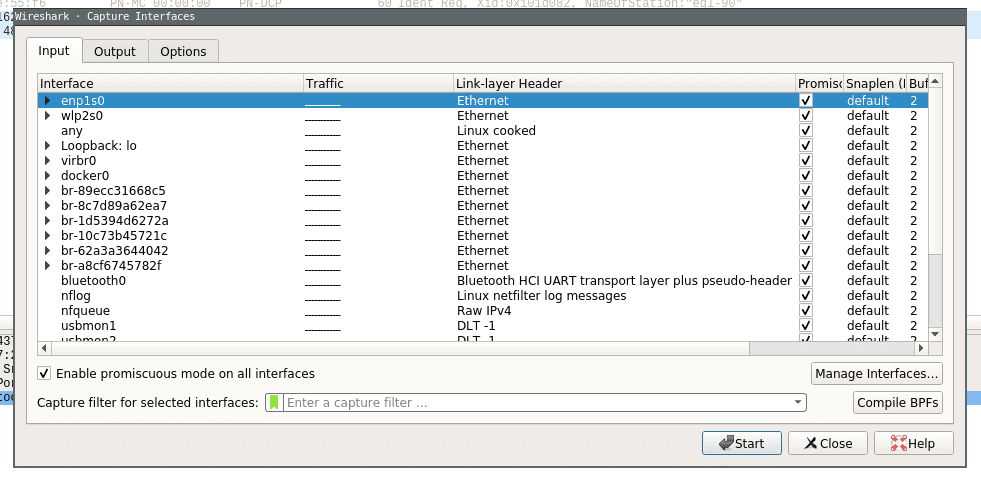
This will open the capture configuration menu. This menu provides options similar to those you already saw on the welcome screen. You can select network devices, set capture filters and configure the capturing process. This time we want to apply a filter before we start capturing data. Select the network interface of your choice and just type ‚tcp‘ into the capture filter dialog box on the bottom of the configuration window like below.
Now when you now start capturing again only packets applicable to the tcp protocol filter are captured and displayed.
More on Filters
Wireshark provides a powerful filter language which not only allows you to narrow down the packets you want to capture but also to sort, follow or even compare their content. This section will only scratch the surface of what is possible with Wireshark so for the time being please consult the Wireshark Wiki for further information about creating filters.
It is a common mistake to believe that capture filters and display filters work the same way in Wireshark. While capture filters change the outcome of the capturing process, display filters can be applied to already running capturing processes to narrow down what to display. Furthermore they use different filter language syntax.
Capture Filter Example
To narrow down our captured data to only include packets from a certain ip range:
src net 192.168.2.0/24Code-Sprache: YAML (yaml)Display Filter Example
The same can be done to filter the already captured data in the main window:
ip.addr == 192.168.2.0/24Code-Sprache: YAML (yaml)Combining Filters
To find exactly what you are looking for on your network you can concatenate different filters. If you want to capture packets from a certain host and port you can simply add both filters together:
host 192.168.2.100 and port 20Code-Sprache: YAML (yaml)You can specify data that you want to explicitly exclude:
host www.google.com and not (port 20 or port 80)Code-Sprache: YAML (yaml)This would only capture data from a certain host which is not transferred on port 20 or 80.
Collecting Data
A standard example to see actual network traffic is to ping a host and collect the data.
Just run a capture and set the capture filter to the host you are going to ping (www.google.com would be a popular choice).
host www.google.comGo ahead and start the capturing process. Without any connections to your host open the main window should stay empty for now.
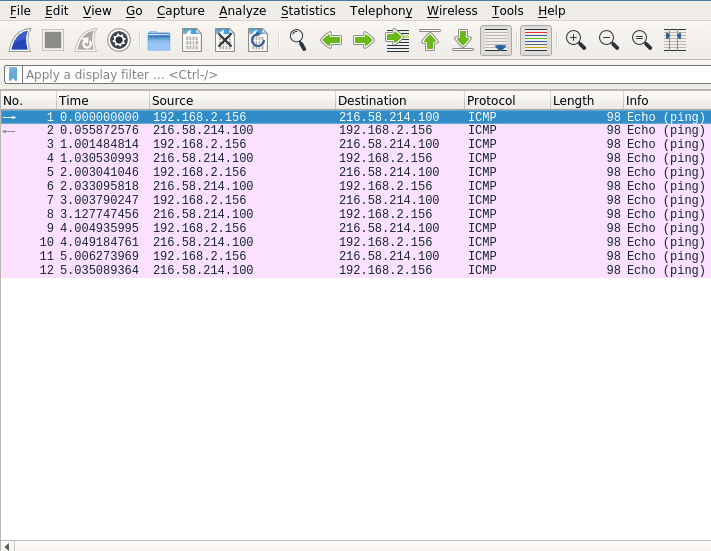
Next open a terminal window and ping the host you specified in the capture filter. Within a few moments you should see the first packets.
Once you have captured some packets press the stop button.
Analyzing at the Data
After collecting data the user interface contains three main parts. Those being the packet list pane, the packet details pane and packet bytes pane.
On top is the packet list pane. This view displays a summary of all the captured packets. You can choose any of the packets by just selecting and the other two views will adapt to the selection. Go ahead and select any of the packets and notice how the other two views change.
The one in the middle is the packet details pane. It shows more details about the packets you select in the packet list pane.
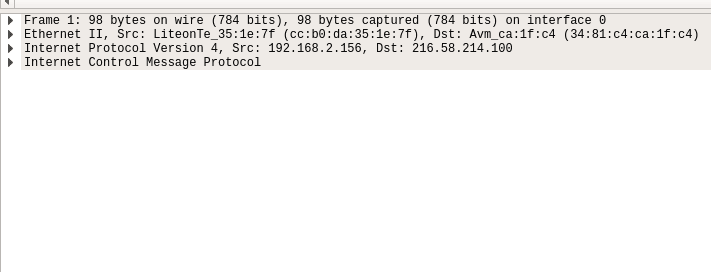
On the bottom the packet bytes pane displays the actual data transferred in the packets.
Using these sections you can view the traffic and break it down for analysis.
Summary
Wireshark is a powerful network packet analyzer. It offers everything you need to capture, filter and view your local network traffic. After reading through this article you should have all the basic knowledge necessary to create and filter simple captures.
Learn More
Need more help?
Can’t find the answer you’re looking for?
Don’t worry, we’re here to help.