Connectware supports a wide range of communication protocols out of the box. However, if you need to connect to a device or sensor that is not yet supported by the Protocol Mapper, you can develop a custom connector.
Custom connectors allow you to add custom connection and endpoint resources to integrate self-developed or less common protocols. You can develop custom connectors, deploy and test them to finally integrate them.
Related Links
Connectware Connectivity Portfolio
This article assumes that you are familiar with the following topics:
Custom connectors are based on the base image of the Protocol Mapper. You can deploy and start custom connectors as agents.
Related Links
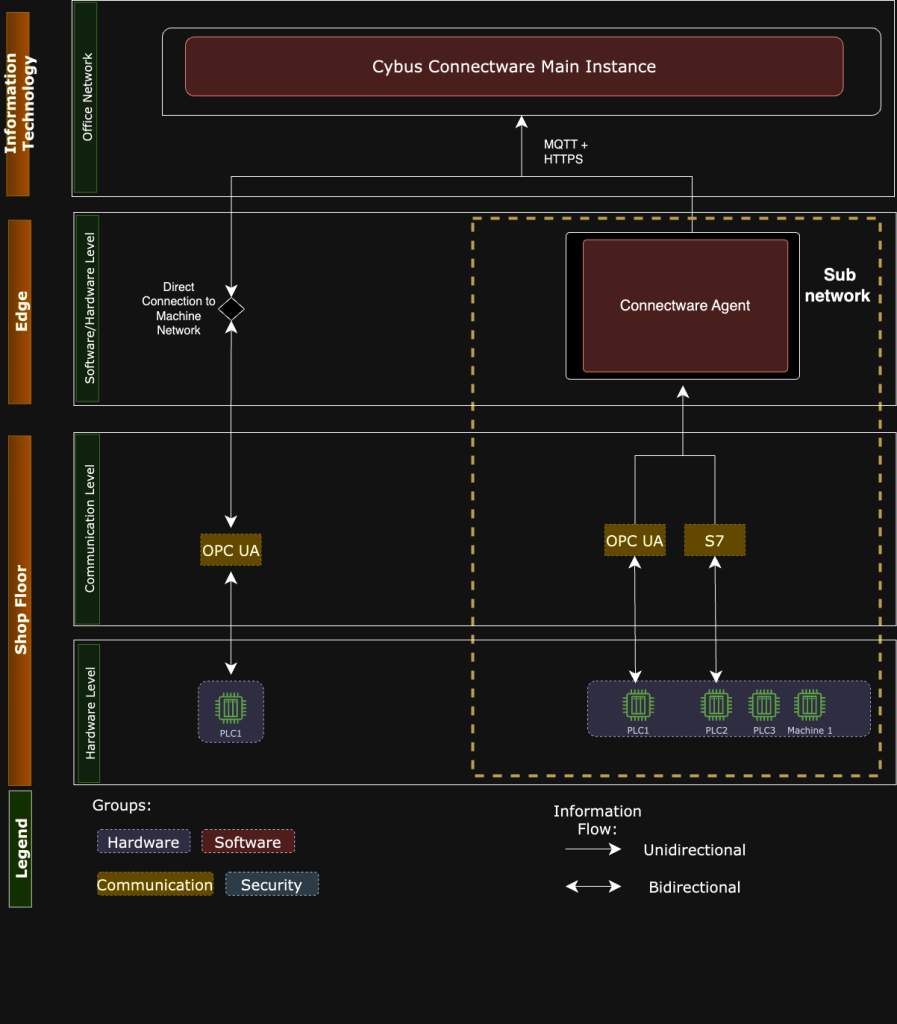
Below is a typical Connectware architecture that uses agents to reach subnetworks or production lines that the main Connectware instance cannot reach.
Note: For the following custom connector development example, we provide a sample base repository on GitHub. We recommend that you clone the base repository and follow the custom connector development guide below.
Sample base repository:
https://github.com/cybusio/custom-connector-tcp-example
Code-Sprache: YAML (yaml)
This base repository has the following structure:
├── Dockerfile
├── examples
│   └── service.yaml
├── package.json
├── package-lock.json
├── README.md
└── src
    ├── CustomConnection.js
    ├── CustomConnection.json
    ├── CustomEndpoint.js
    ├── CustomEndpoint.json
    └── index.js
Code-Sprache: YAML (yaml)
service.yaml is the sample service commissioning file.CustomConnection.js and CustomEndpoint.js contain the basic connection and data handling methods.CustomConnection.json and CustomEndpoint.json are the JSON Schemas that contain the configuration parameters.To implement a custom connector, you need to implement certain methods. The most common methods are Connection and DataHandle.
Connection methods establish connections to machines and handle disconnect and reconnect scenarios. Your protocol connection must typically implement the following Connection methods:
handleConnecthandleDisconnecthandleReconnectTo handle the data, implement the following DataHandle methods:
handleReadhandleWritehandleSubscribe/handleUnsubscribe (optional, otherwise a cron-based polling of read() is provided)To update the process with the correct state, the Connection methods handleConnect, handleDisconnect, and handleReconnect must call the appropriate transition methods of the base class.
The image below shows the different state machines and how they relate to the handle methods:
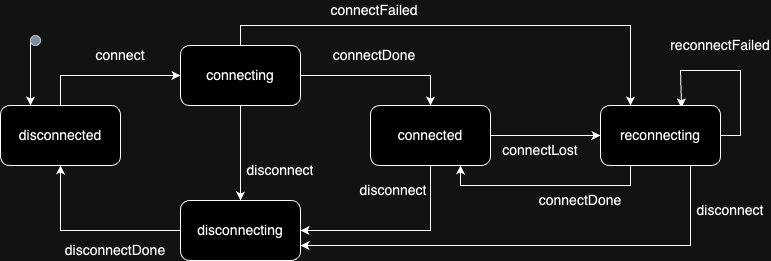
Example: Your handleConnect method will probably start a network operation that receives a callback method that is called when the operation completes successfully or unsuccessfully. In this callback, you must call this.connectDone or this.connectFailed to trigger the correct state transition so that all other hooks and event listeners follow up correctly.
You need to consider two types of Connection methods: The ones that require both a connect and a disconnect method and the ones that require only a connect method, even when reconnecting.
Connect and Disconnect
handleConnect method.handleDisconnect method.handleReconnect method.It is recommended that you add a private method to your class that creates the variables and objects, another private method that deletes them, and call them via the handleConnect, handleDisconnect, and handleReconnect methods.
Connect without Disconnect
constructor of your derived implementation class.Reconnecting
this.connectLost, and implement the handleReconnect method with correct deletion and recreation of your connection objects. However, pay attention to what your client library is doing. The reconnect mechanism of the connection state machine will just start calling handleReconnect with an increasing delay (as configured by the connectionStrategy section in the user parameters).The following code example uses the host and port parameters to establish a TCP connection in the CustomConnection.js file. First, you specify the host and port, then you define your handleConnect method, which calls the createConnection method and opens a TCP connection.
You can call the different states with the following methods:
connectFailedreconnectFailedconnectDoneclass CustomConnection extends Connection {
constructor(params) {
super(params)
this._host = params.connection.host
this._port = params.connection.port
this._client = new Client()
this._client
.on('error', err => { console.log('err:', err.message) })
.on('close', this._onClose.bind(this))
}
// Protocol implementation interface method
async handleConnect() {
await this._createConnection();
}
async _createConnection() {
try {
await this._client.connect(this._host, this._port)
} catch (err) {
switch (this.getState()) {
case 'connecting':
this.connectFailed(err.message)
break
case 'reconnecting':
this.reconnectFailed(err.message)
break
}
return
}
this.connectDone()
}
Code-Sprache: YAML (yaml)There are 2 sets of DataHandle methods:
handleRead/handleWrite for single-message data (similar to POST and GET behavior)handleSubscribe/handleUnsubscribe for data subscriptions (similar to MQTT behavior)If you implement data subscription in your client library, you must implement the handleSubscribe/handleUnsubscribe method pair. Again, this is optional because we can achieve similar behavior by calling the handleRead on schedule. Those receive the address object from the configuration file as first parameter, which in turn was defined in the JSON Schema (CustomEndpoint.json).
Your actual protocol addresses are in the properties of this object according to your JSON Schema. The second argument is the JavaScript callback method which must be called on each data reception, i.e. just like an event listener method. In order to properly unregister that method, your handleUnsubscribe method will receive the same callback method argument so that you can properly unregister it if needed.
async handleSubscribe (address, onData) {
  this._log.info(address, 'handleSubscribe')
  this._client.on(address, onData)
  return this._client.subscribe(address)
}

async handleUnsubscribe (address, onData) {
  this._log.info(address, 'handleUnsubscribe')
  this._client.removeListener(address, onData)
  return this._client.unsubscribe(address)
}
Code-Sprache: YAML (yaml)
For single-message data read and write, you need to implement handleRead/handleWrite, which similarly receives the address as defined in the JSON Schema (CustomEndpoint.json) and the callback that needs to be called with the result.
// Protocol implementation interface method (called for READ and SUBSCRIBE Endpoints)
async handleRead(address, requestData = {}) {
    const data = await this._client.read(address.address)
    return data
}

// Protocol implementation interface method (called for WRITE Endpoints)
async handleWrite(address, writeData) {
    const data = await this._client.write(address.address, writeData)
    return data
}
Code-Sprache: YAML (yaml)The set of all available parameters for each class is described using a JSON Schema. The following code example contains JSON Schemas for all properties (connection parameters) that you can configure in all Connectware resources.
The JSON Schema descriptions are stored in files next to the JavaScript files but with a .json suffix. For example, for Connection.js, the properties are described in the file Connection.json file right next to the JavaScript file. For each derived protocol connection, there must also be JSON Schema files for connection and endpoint.
Related Links
Creating a JSON Schema (json-schema.org)
For the derived connection classes, you must implement a static getCustomSchema method, as shown in the following code example:
const schema = require('./CustomConnection.json');

class CustomConnection extends Connection {
    constructor(params) {
        ....
    }

    // Protocol implementation interface method
    static getCustomSchema() {
        return { ...schema };
    }
Code-Sprache: YAML (yaml)
The JSON Schemas of the derived classes will contain the properties that are specific to that particular connection.
Note: We recommend to add descriptions to all properties.
The object with all properties from the JSON Schema will be passed into the constructor in the base classes, which is then available as this._connection member variable (or this._address in the endpoint) during runtime.
Since a custom connector is based on a pre-built Docker image, you must pass the image tag to the build command. In the code example, the recent BASEIMAGE_VERSION tag is 1.1.1.
docker-compose.yml file. The following code example starts the agent with a server:docker-compose build --build-arg BASEIMAGE_VERSION=1.1.1
Code-Sprache: YAML (yaml)version: "2.4"
services:
# Run the example server
server:
build: .
network_mode: host # Using host network
entrypoint: ''
command: sh -c 'cd /app/src/protocols/custom/utils && node runServer.js'
agent:
build: .
network_mode: host # Using host network
volumes:
- agentData:/data
environment:
CYBUS_MQTT_HOST: localhost # Asuming Cybus Connectware to be reachable on local system
CYBUS_AGENT_MODE: distributed
CYBUS_AGENT_NAME: CustomConnectorAgent
CYBUS_LOG_LEVEL: info
volumes:
agentData:
Code-Sprache: YAML (yaml)docker-compose up -d
Code-Sprache: YAML (yaml)
Result: You can now use your custom connector.
You can use your custom connectors via service commissioning files, just like you use agents.
In this example, you establish the connection via the agent and use the endpoints to fill in the required parameters for the corresponding protocol. Make sure that the agent name matches the agent name that you have specified in the docker-compose.yml file above.
Now, you can develop your data model on the MQTT broker in Connectware like any other service, for example, via mappings.
parameters:

  agentName:
    type: string
    description: Agent Name
    default: custom-connectware-agent # make sure it matches CYBUS_AGENT_NAME

resources:

  customConnection:
    type: Cybus::Connection
    properties:
      protocol: custom-protocol
      agentName: !ref agentName
      connection:
        host: localhost
        port: 50001


  ReadStatus:
    type: Cybus::Endpoint
    properties:
      protocol: custom-connector
      connection: !ref customConnection
      subscribe:
        function: read_status
        interval: 1000
Code-Sprache: YAML (yaml)Itʼs a good idea to make yourself familiar with the following topics before commencing this lesson:
This lesson will focus on the concept of deploying containerised applications with a Connectware service. Step by step we will create a service commissioning file, that deploys a InfluxDB inside Connectware, configure Connectwares internal Reverse Proxy to access the containers in a secure way and to have some data we can write to our InfluxDB we will connect to a public OPC UA server and connect some endpoints. Lets get started building up the service commissioning file.
Services are installed using a commissioning file. Within this text-based YAML file, all so-called resources like connections, endpoints, users, permissions and containerised applications a service uses are listed. Below we will derive an example service commissioning file that deploys a InfluxDB instance that we can later use to visualise our data. If any section of the service commissioning file needs clarification please feel free to visit the Connectware Docs.
These first two sections of the service commissioning file give more general information. In the optional section description you can give a short description of the service which will also be displayed in the services details view on Connectwares Admin User Interface (Admin UI). The section metadata contains the meta information for the service that is being installed. Only the name parameter is required, as it is used as the service ID other parameters as version of the service, icon for the thumbnail of the service, provider of the service or linking to a homepage are optional.
description: >

  third-party Applications as Connectware Services Example
  Cybus Learn - How to deploy third-party applications as Connectware Services

metadata:

  name: third-party applications commissioning file
  version: 1.0.1
  icon: https://www.cybus.io/wp-content/uploads/2019/03/Cybus-logo-Claim-lang.svg
  provider: cybus
  homepage: https://www.cybus.io
Code-Sprache: YAML (yaml)this section can configures values, that are not set during installation. It allows us to create templates from services, where just a parameter like an ip address needs to be changed. In this case we will have the host name and the port of our OPC UA server as parameters. This would allow us to quickly put in any other parameter.
#------------------------------------------------------------------------------
# PARAMETERS
#------------------------------------------------------------------------------

parameters:

  opcuaHost:
    type: string
    description: OPC UA Host Address
    default: opcuaserver.com

  opcuaPort:
    type: integer
    description: OPC UA Host Port
    default: 48010
Code-Sprache: YAML (yaml)If we have some variables that we need more than once we can use definitions for them . We would recommend keeping them at the top of your commissioning file if you need to change them. In this case we used them to define some variables regarding InfluxDB that are needed on several occasions. The service described here is just an example in a real deployment it is recommended to secure passwords and tokens and not have them as clear text in your commissioning files.
#------------------------------------------------------------------------------
# DEFINITIONS
#------------------------------------------------------------------------------

definitions:
  influxdbAdminUsername: admin
  influxdbAdminPassword: supersafepassword #only for example purposes
  influxdbToken: "Em2KIZ5BGJC5Y39HAmtYWqc4nyAhR4c24qt6uGlYxJ4Y1GfOZtntqs3UgH1Ea4158k6gD5UKFps8u5Kc1HvSXB1diCxcz0niJpI"
  influxdbOrg: cybus
Code-Sprache: YAML (yaml)In the Resources section we declare every resource that is needed for our service. All resources like connections, endpoints, users, permissions and containerised applications are configured here.
Containers
Let’s start with the container resources, they comprise the configuration for the Docker Containers the service will deploy. These containers can either come from Docker Hub or from the Cybus Registry. That means any application that is deployed on Connectware can take full advantage of all the containerised software on Docker Hub and your custom containerised software delivered securely through the Cybus Registry. In the example below we pull the official InfluxDB from Docker Hub. Several options that can be used when configuring containers can be found in the Connectware Docs. For the container-specific environmental variables defined under the property environment, you should consult the containerʼs documentation. If you have worked with Docker-Compose before, the configuration of the container should feel familiar.
#------------------------------------------------------------------------------
# RESOURCES
#------------------------------------------------------------------------------

resources:

  #----------------------------------------------------------------------------
  # CONTAINERS
  #----------------------------------------------------------------------------

  influxdb:
    type: Cybus::Container
    properties:
      image: registry.hub.docker.com/library/influxdb:2.6
      ports:
        - 8086:8086
      volumes:
        - !sub '${influxdbDataVolume}:/var/lib/influxdb2'
        - !sub ${influxdbConfigVolume}:/etc/influxdb2
      environment:
        DOCKER_INFLUXDB_INIT_MODE: setup
        DOCKER_INFLUXDB_INIT_ORG: !ref influxdbOrg
        DOCKER_INFLUXDB_INIT_BUCKET: generic
        DOCKER_INFLUXDB_INIT_ADMIN_TOKEN: !ref influxdbToken
        DOCKER_INFLUXDB_INIT_USERNAME: !ref influxdbAdminUsername
        DOCKER_INFLUXDB_INIT_PASSWORD: !ref influxdbAdminPassword
Code-Sprache: YAML (yaml)
Volumes
Our just configured container will need persistent storage space, so we create volumes for them. A volume is a resource that represents a storage space that can be associated with containers. we already linked the container resource to the volume resources we are configuring here in this case one for the database and another one for configurations of Influxdb.
  #----------------------------------------------------------------------------
  # VOLUMES
  #----------------------------------------------------------------------------

  influxdbDataVolume:
    type: Cybus::Volume

  influxdbConfigVolume:
    type: Cybus::Volume
Code-Sprache: YAML (yaml)
Ingress Routes
Now let’s make sure Connectware is actually able to connect to the containers. For that we need to set up some ingress routes which will configure the internal reverse proxy of Connectware. This is needed because service containers running within Connectware architecture are not directly exposed and are running separate from Connectware core containers for security reasons. Ingress routes make them accessible from the outside as well as from within Connectware.
Ingress routes allow communication between Connectware core containers and custom containers. For the InfluxDB container we define a TCP route between the container port 8086 , on which the InfluxDB is available, and Connectware port 8086 .
  # InfluxDB
  influxdbRoute:
    type: Cybus::IngressRoute
    properties:
      container: !ref influxdb
      type: tcp
      containerPort: 8086
      connectwarePort: 8086
Code-Sprache: YAML (yaml)
To learn more details about ingress route resources take a look at the Connectware Docs. If you have problems with your ingress routes have a look at our guide to troubleshoot ingress routes.
Frontend
Now let’s create ourselves a button for easy access to the InfluxDB frontend. To do that we define a link resource that will simply provide a button named InfluxDB on our service details view in Connectwares Admin UI.
  #----------------------------------------------------------------------------
  # FRONTENDS
  #----------------------------------------------------------------------------

  Influx_WebUI:
    type: Cybus::Link
    properties:
      name: InfluxDB
      href: 'http://localhost:8086/'
Code-Sprache: YAML (yaml)
Connection
We have completely configured the container resources and can now treat them like any other protocol we want to utilize in a service.
First thing we have to do is to define a connection to the InfluxDB container we just configured. For the specific case of accessing a containerised application within Connectware, the host has to be defined as connectware. Like previously defined with the ingress route InfluxDB will be available on connectware port 8086 . The name of the InfluxDB bucket to store information is not really important in this use case and will be set to generic. The transport scheme will be set to http. To have some data to feed into our influxDB in this example we also connect to a public OPC UA server from opcuaserver.com. It is the same one we used in the How to connect to an OPC UA Server article.
  #----------------------------------------------------------------------------
  # CONNECTIONS
  #----------------------------------------------------------------------------

  influxdbConnection:
    type: Cybus::Connection
    properties:
      protocol: Influxdb
      connection:
        scheme: http
        host: connectware
        bucket: generic
        token: !ref influxdbToken
        org: !ref influxdbOrg

  opcuaConnection:
    type: Cybus::Connection
    properties:
      protocol: Opcua
      connection:
        host: !ref opcuaHost
        port: !ref opcuaPort
        #username: myUsername
        #password: myPassword
Code-Sprache: YAML (yaml)
Endpoints
To now be able to write some data into InfluxDB we setup a write Endpoint which is writing a measurement called airconditioner.
  #----------------------------------------------------------------------------
  # ENDPOINTS
  #----------------------------------------------------------------------------

  # InfluxDB

  airconditionerWrite:
    type: Cybus::Endpoint
    properties:
      protocol: Influxdb
      connection: !ref influxdbConnection
      write:
        measurement: airconditioner
Code-Sprache: YAML (yaml)
To have some data we can push into that endpoint we connect to some endpoints on the public OPC UA server.
  # OPCUA

  currentTime:
    type: Cybus::Endpoint
    properties:
      protocol: Opcua
      connection: !ref opcuaConnection
      subscribe:
        nodeId: i=2258

  Humidity:
    type: Cybus::Endpoint
    properties:
      protocol: Opcua
      connection: !ref opcuaConnection
      subscribe:
        nodeId: ns=3;s=AirConditioner_1.Humidity

  PowerConsumption:
    type: Cybus::Endpoint
    properties:
      protocol: Opcua
      connection: !ref opcuaConnection
      subscribe:
        nodeId: ns=3;s=AirConditioner_1.PowerConsumption

  Temperature:
    type: Cybus::Endpoint
    properties:
      protocol: Opcua
      connection: !ref opcuaConnection
      subscribe:
        nodeId: ns=3;s=AirConditioner_1.Temperature

  TemperatureSetpointSub:
    type: Cybus::Endpoint
    properties:
      protocol: Opcua
      connection: !ref opcuaConnection
      subscribe:
        nodeId: ns=3;s=AirConditioner_1.TemperatureSetPoint
Code-Sprache: YAML (yaml)
To learn more about the details of defining connections and endpoints utilising various protocols, explore other lessons on Cybus Learn. For details of further protocols you can also consult the Protocol Details in our Docs.
Mappings
To actually write the data from our OPC UA endpoints into our InfluxDB endpoint we need Mappings. We will additionally do some data pre-processing in this mapping to get the information about the data origin to the database and for that we utilise a so-called rule. This rule is powered by Connectwares Rule Engine which uses JSONata as a powerful query and transformation language. The expression in this case will add the name of the last subtopic to the messageʼs JSON string under the key “measurement” . The value of this key will overwrite the default measurement name we defined in the endpoint definition when sent to InfluxDB. It is determined by the + operator in the subscribe topic definition that acts as a wildcard while deriving a context variable named measurement .
#----------------------------------------------------------------------------
  # MAPPINGS
  #----------------------------------------------------------------------------

  influxdbMapping:
    type: Cybus::Mapping
    properties:
      mappings:
        - subscribe:
            topic: 'building-automation/airconditioner/1/+measurement'
          publish:
            endpoint: !ref airconditionerWrite
          rules:
            - transform:
                expression: '$merge([$,{"measurement": $context.vars.measurement}])'
Code-Sprache: YAML (yaml)
To bring the OPC UA data into the right format we setup some mappings that publishes the data under the topic prefix building-automation/airconditioner/1/
  mqttMapping:
    type: Cybus::Mapping
    properties:
      mappings:
        - subscribe:
            endpoint: !ref currentTime
          publish:
            topic: 'server/status/currenttime'
        - subscribe:
            endpoint: !ref Humidity
          publish:
            topic: 'building-automation/airconditioner/1/humidity'
        - subscribe:
            endpoint: !ref PowerConsumption
          publish:
            topic: 'building-automation/airconditioner/1/power-consumption'
        - subscribe:
            endpoint: !ref Temperature
          publish:
            topic: 'building-automation/airconditioner/1/temperature'
        - subscribe:
            endpoint: !ref TemperatureSetpointSub
          publish:
            topic: 'building-automation/airconditioner/1/temperature-setpoint'
        - subscribe:
            topic: 'building-automation/airconditioner/1/temperature-setpoint/set'
          publish:
            endpoint: !ref TemperatureSetpointWrite
Code-Sprache: YAML (yaml)
With all of these Mappings in place we have now successfully connected our OPC UA data with our newly installed influxDB. The data is now flowing into the database.
If you installed and enabled the service you should see a „InfluxDB“-Button on the Service Page next to the Links section. The Button is the result of the link resource we defined and will in this case open a new tab with InfluxDBs Web-UI.
On the login screen of InfluxDB type in the username and password you set in your service commissioning file.
Lets create our first Dashboard. Therefore click on “Create Dashboard” and in the dashboard editor click “Add Cell”. This should look similar to the screenshot below. When you select the generic bucket you should see the defined OPC-UA endpoints. Select the data you want to display and customize the cell to your liking.
Here is an example dashboard displaying the data from the OPC-UA endpoints we configured in our commissioning file.
In this lesson we learned how to deploy containerised applications as Connectware Services on the example of InfluxDB a time series database that provides some simple visualisation via its Web UI or could be used to build up some more sophisticated Dashboards using Grafana in the future.
Learn more about Connectware in our Connectware Docs or explore more lessons here on Cybus Learn. If you would like to know how to include user management in your service, take a look at the lesson on User Management Basics.
In this lesson, we will send data from Cybus Connectware to an Elasticsearch Cluster.
As a prerequisite, it is necessary to set up the Connectware instance and the Elasticsearch instance to be connected. In case of joining a more advanced search infrastructure, a Logstash instance between Connectware and the Elasticsearch cluster may be useful.
We assume you are already familiar with Cybus Connectware and its service concept. If not, we recommend reading the articles Connectware Technical Overview and Service Basics for a quick introduction. Furthermore, this lesson requires basic understanding of MQTT and how to publish data on an MQTT topic. If you want to refresh your MQTT knowledge, we recommend looking at the lessons MQTT Basics and How to connect an MQTT client to publish and subscribe data.
This article provides general information about Elasticsearch and its role in the Industrial IoT context along with a hands-on section about the Cybus Connectware integration with Elasticsearch.
If you are already familiar with Elasticsearch and its ecosystem, jump directly to the hands-on section. See: Using Filebeat Docker containers with Cybus Connectware.
The article concludes by describing some aspects of working with relevant use cases for prototyping, design decisions and reviewing the integration scenario.
Elasticsearch is an open-source enterprise-grade distributed search and analytics engine built on Apache Lucene. Lucene is a high-performance, full-featured text search engine programming library written in Java. Since its first release in 2010, Elasticsearch has become widely used for full-text search, log analytics, business analytics and other use cases.
Elasticsearch has several advantages over classic databases:
Mastering these features is a known challenge, since working with Elasticsearch and search indices in general can become quite complex depending on the use case. The operational effort is also higher, but this can be mitigated by using managed Elasticsearch clusters offered by different cloud providers.
Elasticsearch inherently comes with a log aggregator engine called Logstash, a visualization and analytics platform called Kibana and a collection of data shippers called Beats. These four products are part of the integrated solution called the “Elastic Stack”. Please follow the links above to learn more about it.
When it comes to Industrial IoT, we speak about collecting, enriching, normalizing and analyzing huge amounts of data ingested at a high rate even in smaller companies. This data is used to gain insights into production processes and optimize them, to build better products, to perform monitoring in real time, and last but not least, to establish predictive maintenance. To benefit from this data, it needs to be stored and analyzed efficiently, so that queries on that data can be made in near real time.
Here a couple of challenges may arise. One of them could be the mismatch between modern data strategies and legacy devices that need to be integrated into an analytics platform. Another challenge might be the need to obtain a complete picture of the production site, so that many different devices and technologies can be covered by an appropriate data aggregation solution.
Some typical IIoT use cases with the Elastic Stack include:
Elastic Stack has become one of several solutions for realizing such use cases in a time and cost efficient manner, and the good thing is that Elasticsearch can be easily integrated into the shop floor with Cybus Connectware.
Cybus Connectware is an ideal choice for this because its protocol abstraction layer is not only southbound protocol agnostic, supporting complex shop floor environments with many different machines, but also agnostic to the northbound systems. This means that customers can remain flexible and realize various use cases according to their specific requirements. For example, migrating a Grafana-based local monitoring system to Kibana, an Elastic Stack-based real time monitoring Dashboard, is a matter of just a few changes.
The learning curve for mastering Elasticsearch is steep for users who try it for the first time. Maintaining search indices and log shippers can also be complex for some use cases. In those cases, it might be easier and more efficient to integrate machines into an IIoT edge solution, such as Connectware.
Here are some benefits of using Cybus Connectware at the edge to stream data to Elasticsearch:
Nevertheless, when ingesting data the Filebeat and Logstash data processing features may also be very useful for normalizing data for all data sources, not just IIoT data from OT networks.
Before proceeding further, you should first obtain access credentials for an existing Elasticsearch cluster, or set up a new one. For this, follow the instructions below:
The simplest and most reliable way of communication when integrating Cybus Connectware with Elasticsearch is the MQTT Input for a Filebeat instance. An additional advantage of the Connectware MQTT connector is built-in data buffering, which means that data is stored locally when there is temporary connection failure between the Filebeat and the Elasticsearch Cluster:
Embedding the Filebeat Docker Image into Connectware is easy because Connectware comes with an integrated interface for running Edge Applications. Once started, the docker container connects to the integrated Connectware Broker to fetch and process the data of interest.
All you have to do is to create a Connectware Service by writing a Commissioning File and install it on the Connectware instance. To learn more about writing Commissioning Files and Services, head over to the Learn Article called Service Basics.
Now let’s get straight to the point and start writing the Commissioning File.
This is the basic structure of a commissioning file:
---
description: Elastic Filebeat reading MQTT Input

metadata:
  name: Filebeat

parameters:

definitions:

resources:
Code-Sprache: YAML (yaml)Add a Cybus::Container Resource for the filebeat to the resources section in the template. This will later allow you to run the Container when installing and enabling the Service, using the docker image from docker.elastic.co directly:
resources:
  filebeat:
    type: Cybus::Container
    properties:
      image: docker.elastic.co/beats/filebeat:7.13.2
      volumes:
        - /var/run/docker.sock:/var/run/docker.sock:ro
Code-Sprache: YAML (yaml)When starting the filebeat container, various variables must be configured correctly. In this example, these variables should not be integrated into a specialized container image. Instead, the variables should be configured “on the fly” when starting the standard container image from within Connectware, so that the entire configuration is stored in a single commissioning file. For this purpose, all configuration settings of the filebeat container are specified in the helper section of the commissioning file, defining a variable called CONFIG inside of the file’s definitions section:
definitions:
  CONFIG: !sub |
    filebeat.config:
      modules:
        path: /usr/share/filebeat/modules.d/*.yml
        reload.enabled: false

    filebeat.inputs:
    - type: mqtt
      hosts:
        - tcp://${Cybus::MqttHost}:${Cybus::MqttPort}
      username: admin
      password: admin
      client_id: ${Cybus::ServiceId}-filebeat
      qos: 0
      topics:
        - some/topic

    setup.ilm.enabled: false
    setup.template.name: "some_template"
    setup.template.pattern: "my-pattern-*"

    output.elasticsearch:
      index: "idx-%{+yyyy.MM.dd}-00001"

    cloud.id: "elastic:d2V***"
    cloud.auth: "ingest:Xbc***"
Code-Sprache: YAML (yaml)Now that the Filebeat configuration is set up, the container resource filebeat mentioned above needs to be extended in order to use this configuration on startup (in this and the following examples, the top-level headline resources: is skipped for brevity):
filebeat:
  type: Cybus::Container
  properties:
    image: docker.elastic.co/beats/filebeat:7.13.2
    entrypoint: [""]
    command:
      - "/bin/bash"
      - "-c"
      - !sub 'echo "${CONFIG}" > /tmp/filebeat.docker.yml && /usr/bin/tini -s -- /usr/local/bin/docker-entrypoint -c /tmp/filebeat.docker.yml -environment container'
    volumes:
      - /var/run/docker.sock:/var/run/docker.sock:ro
Code-Sprache: YAML (yaml)The filebeat container needs access credentials to set up the cloud connection correctly. Those credentials should not be written into the file as hard-coded values though. Credentials as hard-coded values should be avoided not only for security reasons, but also to make the commissioning file re-usable and re-configurable for many more service operators. To easily achieve this, we are going to use parameters.
In the parameters section we are creating two parameters of type string:
parameters:
  filebeat-cloud-id:
    type: string
    description: The cloud id string, for example elastic:d2V***

  filebeat-cloud-auth:
    type: string
    description: The cloud auth string, for example ingest:Xbc***
Code-Sprache: YAML (yaml)
These parameters are now ready to be used in our configuration. During the installation of the service, Connectware will ask us to provide the required values for these parameters.
To use the parameters in the configuration, the following lines in the Filebeat configuration (the CONFIG definition from above) need to be adapted:
  cloud.id: "${filebeat-cloud-id}"
  cloud.auth: "${filebeat-cloud-auth}"
Code-Sprache: YAML (yaml)The filebeat container is using access credentials not only for the cloud connection but also for the local input connection, which is the connection to the Connectware MQTT broker. Those access credentials have been set to the default credentials (admin/admin) in the definition above, which now need to be adapted to the actual non-default credentials. For your convenience, Connectware already has Global Parameters that are replaced by the current credentials of the MQTT broker. So the following lines in the Filebeat configuration (the CONFIG definition from above) need to be adapted, too:
  username: ${Cybus::MqttUser}
  password: ${Cybus::MqttPassword}
Code-Sprache: YAML (yaml)Finally the defaultRole for this service requires additional read permissions for all MQTT topics which the service should consume. To grant these additional privileges, another resource should be added:
resources:
  defaultRole:
    type: Cybus::Role
    properties:
      permissions:
        - resource: some/topic
          operation: read
          context: mqtt
Code-Sprache: YAML (yaml)In the end, the entire service commissioning file should look like this:
---
description: Elastic Filebeat reading MQTT Input

metadata:
  name: Filebeat

parameters:
  filebeat-cloud-id:
    type: string
    description: The cloud id string, for example elastic:d2V***

  filebeat-cloud-auth:
    type: string
    description: The cloud auth string, for example ingest:Xbc***

definitions:
  # Filebeat configuration
  CONFIG: !sub |
    filebeat.config:
      modules:
        path: /usr/share/filebeat/modules.d/*.yml
        reload.enabled: false

    filebeat.inputs:
    - type: mqtt
      hosts:
        - tcp://${Cybus::MqttHost}:${Cybus::MqttPort}
      username: ${Cybus::MqttUser}
      password: ${Cybus::MqttPassword}
      client_id: ${Cybus::ServiceId}-filebeat
      qos: 0
      topics:
        - some/topic

    setup.ilm.enabled: false
    setup.template.name: "some_template"
    setup.template.pattern: "my-pattern-*"

    output.elasticsearch:
      index: "idx-%{+yyyy.MM.dd}-00001"

    cloud.id: "${filebeat-cloud-id}"
    cloud.auth: "${filebeat-cloud-auth}"

resources:
  # The filebeat docker container
  filebeat:
    type: Cybus::Container
    properties:
      image: docker.elastic.co/beats/filebeat:7.13.1
      entrypoint: [""]
      command:
        - "/bin/bash"
        - "-c"
        - !sub 'echo "${CONFIG}" > /tmp/filebeat.docker.yml && /usr/bin/tini -- /usr/local/bin/docker-entrypoint -c /tmp/filebeat.docker.yml -environment container'
      volumes:
        - /var/run/docker.sock:/var/run/docker.sock:ro

  # Gaining privileges
  defaultRole:
    type: Cybus::Role
    properties:
      permissions:
        - resource: some/topic
          operation: read
          context: mqtt
Code-Sprache: YAML (yaml)
This commissioning file can now be installed and enabled, which will also start the filebeat container and set up its connections correctly. However, there is probably no input data available yet, but we will get back to this later. Depending on the input data, an additional structure should be prepared for useful content in Elasticsearch, which is described in the next section.
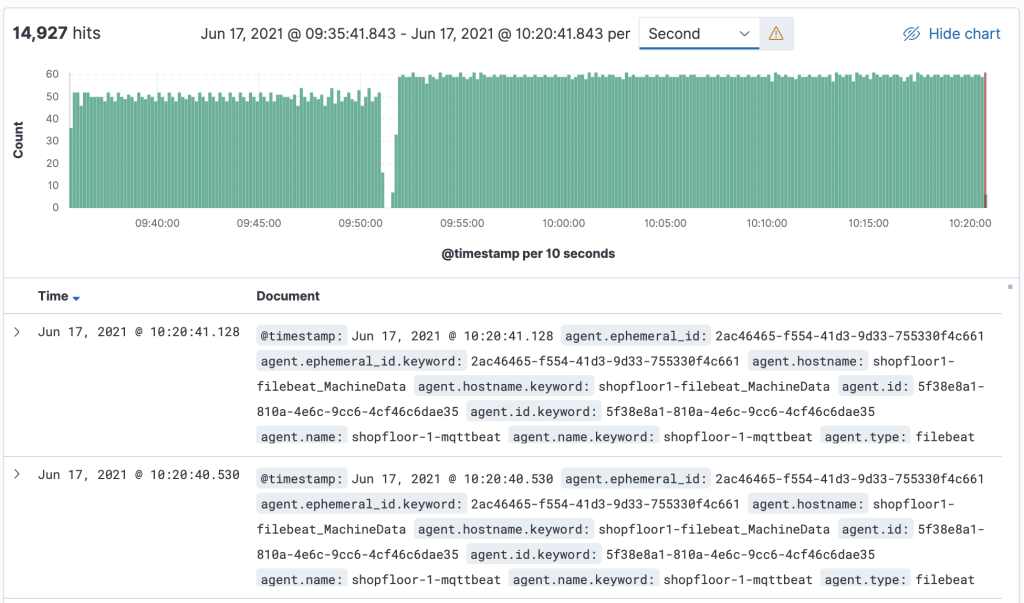
The first contact with the Elasticsearch cluster can be verified by sending some message to the topic to which the Filebeat MQTT inputs are subscribed (here: “some/topic”) and reviewing the resulting event in Kibana.
Once this is done, a service integrator may identify several elements of the created JSON document that need to be changed. The deployed Connectware service commissioning file allows us to ship incoming MQTT messages in configured topics to the Elasticsearch cluster as a JSON document with certain meta data that an operator may want to change to improve the data source information.
For example, a message sent using the service described above contains multiple fields with identical values, in this case agent.name, agent.hostname and host.name. This is due to the naming convention for container resources in a service commissioning files described in the Connectware Container Resource. As the ServiceId is “filebeat”, and the container resource is named “filebeat” too, the resulting container name, hostname and agent name in the transmitted search index documents are “filebeat-filebeat”, which looks as follows:
...
"fields": {
...
   "agent.name": [
     "filebeat-filebeat"
   ],
   "host.name": [
     "filebeat-filebeat"
   ],
...
   "agent.hostname": [
     "filebeat-filebeat"
   ],
...
Code-Sprache: YAML (yaml)
To get appropriate names in the search index for further evaluation and post processing, either change the serviceId and/or container resource name in the service commissioning file, or use Filebeat configuration options to set an alternative agent.name (by default is derived from the hostname, which is the container hostname created by Connectware). Be aware that the maximum number of characters for the clientId in Filebeat mqtt.input configuration is 23.
Change both the service name (serviceId) and the container resource name to identify the respective device as the data source, and redeploy the service commissioning file:
...
metadata:
  name: Shopfloor 1

...
resources:
  # The filebeat docker container
  filebeat_Machine_A_032:
...
Code-Sprache: YAML (yaml)
In addition to this, the Filebeat configuration can be modified slightly to set the agent.name appropriately along with some additional tags to identify our edge data sources and data shipper instance (is useful to group transactions sent by this single Beat):
...
definitions:
  CONFIG: !sub
...
   name: "shopfloor-1-mqttbeat"
   tags: [ "Cybus Connectware", "edge platform", "mqtt" ]
...
Code-Sprache: YAML (yaml)
This leads to improved field values in the search index, so that transactions can be better grouped in the search index, such as this:
...
"fields": {
...
   "agent.name": [
     "shopfloor-1-mqttbeat"
   ],
   "host.name": [
     "shopfloor-1-mqttbeat"
   ],
...
   "agent.hostname": [
     "shopfloor1-filebeat_Machine_A_032"
   ],
...
   "tags": [
     "Cybus Connectware",
     "edge platform",
     "mqtt"
   ],
...

Code-Sprache: YAML (yaml)Using Cybus Connectware offers extensive flexibility in mapping devices, configuring pre-processing rules and adding many different resources. It is up to the customer to define the requirements, so that a well-architected set of services can be derived for the Connectware instance.
To stream machine data collected by Connectware to Elasticsearch, existing MQTT topics can be subscribed by the Filebeat container. Alternatively, the Filebeat container can subscribe to MQTT topics that contain specific payload transformation. For instance, a normalized payload for an Elasticsearch index specifies an additional timestamp or specific data formats.
The advantage of using Connectware to transmit data to Elasticsearch is that it supports a lightweight rules engine to map data from different machines to Filebeat by just working with MQTT topics, for example:
resources:
  # mapping with enricher pattern for an additional timestamp
  machineDataMapping:
    type: Cybus::Mapping
    properties:
      mappings:
       - subscribe:
            topic: !sub '${Cybus::MqttRoot}/machineData/+field'
          rules:
            - transform:
                expression: |
                  (
                    $d := { $context.vars.field: value };
                    $merge(
                      [
                        $last(),
                        {
                          "coolantLevel": $d.`coolantLevel`,
                          "power-level": $d.`power-level`,
                          "spindleSpeed": $d.`spindleSpeed`,
                          "timestamp": timestamp
                        }
                      ]
                    )
                  )
          publish:
            topic: 'some/topic'

Code-Sprache: YAML (yaml)
A reasonable structural design of related Connectware service commissioning files depends on the number of machines to connect, their payload, complexity of transformation and the search index specifications in the Elasticsearch environment. See the Github project for a more advanced example concerning machine data transformation.
To explain these settings in detail, Cybus provides a complete Connectware documentation and Learn articles like Service Basics.
What has been added to the original Filebeat configuration is the typical task of a service operator connecting shopfloor devices and organizing respective resources in a Connectware service commissioning file. The service operator has further options to decompose this file to multiple files to optimize the deployment structure in this Low-code/No-code environment for their needs. Contact Cybus to learn more about good practices here.
Now that the data is transmitted to the Elasticsearch cluster, further processing is up to the search index users. The Elastic Stack ecosystem provides tools for working with search indices created from our data, such as simple full text search with Discovery, Kibana visualizations or anomaly detection and so on.
The message is transmitted as a message string and will be stored as a JSON document with automatically de-composed payload and associated metadata for the search index. A simple discovery of that continuously collected data shows something like this:
This lesson offered a brief introduction into the integration of Cybus Connectware with Elasticsearch using the Connectware built-in MQTT connector and the FileBeat with MQTT Input in a service commissioning file.
Additionally, Cybus provides sample service commissioning files and some other technical details in the Github project How to integrate Elasticsearch with Connectware.
As a next step, you can use Cybus Connectware to organize data ingestion from multiple machines for its further use with the Elastic Stack.
With the combined solution of Cybus Connectware and the Waylay Automation Platform, business users and IT professionals can build their own smart industrial use cases.
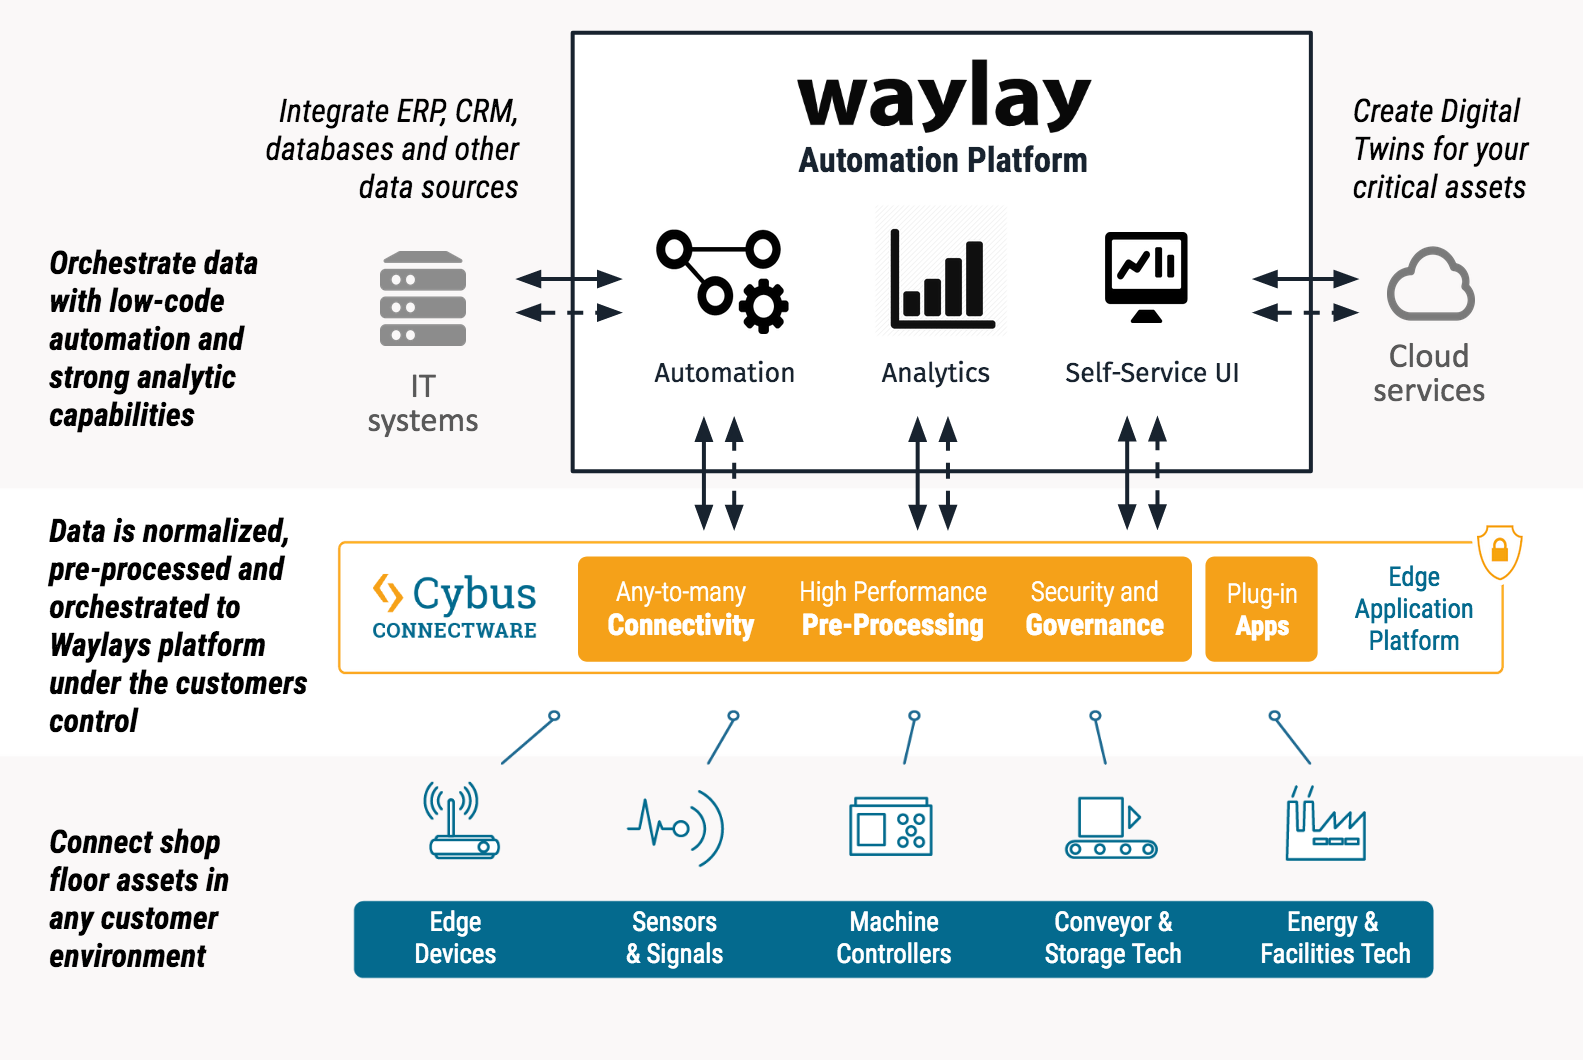
The following video demonstrates, how three use cases can be realized with both, the Cybus Connectware and the Waylay Auomation Platform in combination.
The demonstration video delivers not only insights into both platforms and their user interface, but also delivers a step-by-step guide for three use cases. It is shown how to create:
1. Transparency in customer’s shop floor
2. Prediction of critical coolant level
3. Realization of a service level agreement based on machine data
For these use cases, the Cybus Connectware enables a connection of two milling machines from different generations (Modbus TCP and OPC UA) to extract real-time data. Temperature as well as coolant liquid level will be scanned. With the Connectware, the data is normalized and a common information model is created.
To provide the data to Waylay’s Automation Platform, it is made available in MQTT.
The Waylay Automation Platform then visualizes the machine data by offering a user-friendly dashboard. The demo video also shows how to create a business logic and the workflow needed for the three use cases with the Waylay Automation Platform.
We know how unique the use cases and technical infrastructure of each company are. We therefore invite you for a live demo that picks up your current situation or your future goals. Get your live demo to find out what Cybus Connectware adds to your company:
This lesson assumes that you want to set up an OPC Unified Architecture (a.k.a OPC UA) server as an integrated Connectware resource which other clients can connect to. To understand the basic concepts of the Connectware, please take a look at the Technical Overview lesson.
To follow along with the example, you will need a running instance of the Connectware 1.0.18 or later. In case you do not have that, learn How to install the Connectware.
In this article we will create a Connectware service which configures and enables the OPC UA server. If you are new to services and creating commissioning files, read our article about Service Basics. If you would like to set up the Connectware as an OPC UA client, please view the article How to Connect to an OPC UA Server.
This article will teach you how to use the Connectware OPC UA server resource in your system setup. In more detail, the following topics are covered:
You can download the service commissioning file that we use in this example from the Cybus GitHub repository.
We will use Prosys OPC UA Client for testing in this guide. However, it is up to you to decide which tool to work with. You can use FreeOpcUa’s Simple OPC UA GUI client, which is open source and available for all major OS’s. If you feel more comfortable working on the terminal, go for Etienne Rossignon’s opcua-commander. In case you prefer online tools, try One-Way Automation’s OPC UA Web Client. It is free to use, but you will be asked to sign up first and you will not be able to connect to servers on your local network.
Since the release of version 1.0.18, Connectware supports a new type of resource that can be utilized in services: The server resource enables services to run servers within Connectware and the first protocol supported by this resource is OPC UA. Thus, you can set up an OPC UA server, which can be used to receive data from or provide data to devices or applications mainly in industrial environments. Being fully integrated into Connectware, this feature allows to reduce the overheads in selecting, deploying, maintaining and integrating a separate software for fulfilling this demand in your system.
The OPC UA server is internally connected to the Connectwares protocol mapper, which means that you can map your data from any other protocol supported by the Connectware directly on data nodes of the OPC UA server. In the service commissioning file, OPC UA server nodes can be handled just as any other endpoint. Therefore, you can use them in mappings as usual by simply defining the data source and target.
The Commissioning File contains all resource definitions and is read by Connectware. To understand the file’s anatomy in detail, please consult our Reference docs.
Start by opening a text editor and creating a new file, e.g. opcua-server-example-commissioning-file.yml. The commissioning file is in the YAML format, perfectly readable for both humans and machines! We will now go through the process of defining the required sections for this example.
These sections contain more general information about the commissioning file. You can give a short description and add a stack of metadata. As for metadata, only the name is required, while the rest is optional. We will use the following set of information for this lesson:
description: >

 OPC UA Server Example Commissioning File
 Cybus Learn - How to set up the integrated Connectware OPC UA server
 https://www.cybus.io/learn/how-to-set-up-the-integrated-connectware-opc-ua-server/

metadata:

 name: OPC UA Server Example Commissioning File
 version: 1.0.0
 icon: https://www.cybus.io/wp-content/uploads/2019/03/Cybus-logo-Claim-lang.svg
 provider: cybus
 homepage: https://www.cybus.io
Code-Sprache: YAML (yaml)In the resources section we declare every resource that is needed for our application. The first necessary resource is the OPC UA server.
resources:
 opcuaServer:
   type: Cybus::Server::Opcua
   properties:
     port: 4841
     resourcePath: /UA/CybusOpcuaServer
     alternateHostname: localhost
     applicationUri: 'urn:cybus:opcua:server:1'
     allowAnonymous: true
     securityPolicies: ["None", "Basic256Sha256"]
     securityModes: ["None", "SignAndEncrypt"]
Code-Sprache: YAML (yaml)
We create the OPC UA server by defining the type of the resource, namely Cybus::Server::Opcua. Then we define its properties: we set the port to 4841 to not get in conflict with other possibly present OPC UA servers. You can also set values for resourcePath and applicationUri, however in this case we proceed with the default ones. We have to set the alternateHostname to the own IP address of the Connectware host and we set allowAnonymous to true, so we can access the server without creating a user for this example. Note that this is not recommended for productive environments. With securityPolicies and securityModes we can define the options that should be supported by the server as an array.
The next resources needed are the OPC UA server nodes. Let’s extend our list with some resources of the type Cybus::Node::Opcua.
1_root:
   type: Cybus::Node::Opcua
   properties:
     nodeType: Object
     parent: !ref opcuaServer
     nodeId: ns=1;s=1_root
     browseName: "root"

 1.1_DataNodes:
   type: Cybus::Node::Opcua
   properties:
     nodeType: Object
     parent: !ref 1_root
     nodeId: ns=1;s=1.1_DataNodes
     browseName: "DataNodes"
Code-Sprache: YAML (yaml)
The node resources of the OPC UA server build up a hierarchy of objects and variables. We create two levels of parent nodes here, which are of the nodeType Object. The first level is the root node. This has the server itself as a parent and we reference the server resource by using !ref opcuaServer. The second level then has the root as a parent, also defined by referencing. In this way, you can build up a hierarchy in which you can then create your variable nodes.
1.1.1_Boolean:
   type: Cybus::Node::Opcua
   properties:
     nodeType: Variable
     parent: !ref 1.1_DataNodes
     operation: serverProvides
     nodeId: ns=1;s=1.1.1_Boolean
     browseName: Boolean
     dataType: Boolean
     initialValue: false

 1.1.2_Int32:
   type: Cybus::Node::Opcua
   properties:
     nodeType: Variable
     parent: !ref 1.1_DataNodes
     operation: serverReceives
     nodeId: ns=1;s=1.1.2_Int32
     browseName: Int32
     dataType: Int32
     initialValue: 0

 1.1.3_String:
   type: Cybus::Node::Opcua
   properties:
     nodeType: Variable
     parent: !ref 1.1_DataNodes
     operation: serverProvidesAndReceives
     nodeId: ns=1;s=1.1.3_String
     browseName: String
     dataType: String
     initialValue: "intial"
Code-Sprache: YAML (yaml)
The variable nodes are of the type Cybus::Node::Opcua as well, but their nodeType is Variable. As a parent for our variables, we choose !ref 1.1_dataNodes. The operation which these nodes should serve can be of three types: serverProvides, serverReceives and serverProvidesAndReceives. serverProvides is a node which provides data and can be read by the OPC UA client. serverReceives is a node that receives data from an OPC UA client, while serverProvidesAndReceives nodes can be used in both ways. Furthermore, we choose a dataType for every variable and an initialValue which is the value present on the node after the server has started.
For all nodes in this section we defined a nodeId and a browseName, which can be used to address the nodes. The node ID must be unique on the server. The browse name can be used multiple times, but any browse path derived from it must be unique. However, explaining the OPC UA address space is certainly out of scope for this lesson. If you would like to learn more about the concepts of the OPC UA address space, then the Address Space Concepts documentation by Unified Automation will be a good place to start.
At this point we would already be able to read and write values to the OPC UA server utilizing OPC UA clients. However, to transfer data from devices or applications using other protocols to the OPC UA server, we have to create a mapping. This will allow us to forward data from any other protocol to be provided through the OPC UA server, or conversely, forward data received through the OPC UA server to any other protocol.
MqttMapping:
   type: Cybus::Mapping
   properties:
     mappings:
       - subscribe:
           topic: "opcua/provides/boolean"
         publish:
           endpoint: !ref 1.1.1_Boolean
       - subscribe:
           endpoint: !ref 1.1.2_Int32
         publish:
           topic: "opcua/receives/int32"
       - subscribe:
           endpoint: !ref 1.1.3_String
         publish:
           topic: "opcua/receives/string"
       - subscribe:
           topic: "opcua/provides/string"
         publish:
           endpoint: !ref 1.1.3_String
Code-Sprache: YAML (yaml)
In this case we want to provide the boolean values published on the MQTT topic opcua/provides/boolean, which will be provided on the OPC UA server node 1.1.1_Boolean. We will achieve this by referencing the node using !ref. Furthermore, we want the values received by the OPC UA node 1.1.2_Int32 to be published on MQTT topic opcua/receives/int32. To be able to use 1.1.3_String in both directions, we need to create two mappings: one to publish received values on opcua/receives/string and one to provide values published on opcua/provides/string to the OPC UA clients.
Instead of publishing or subscribing to MQTT topics, we could also reference endpoints on connections of other protocols in the same way as we do it for the OPC UA server nodes.
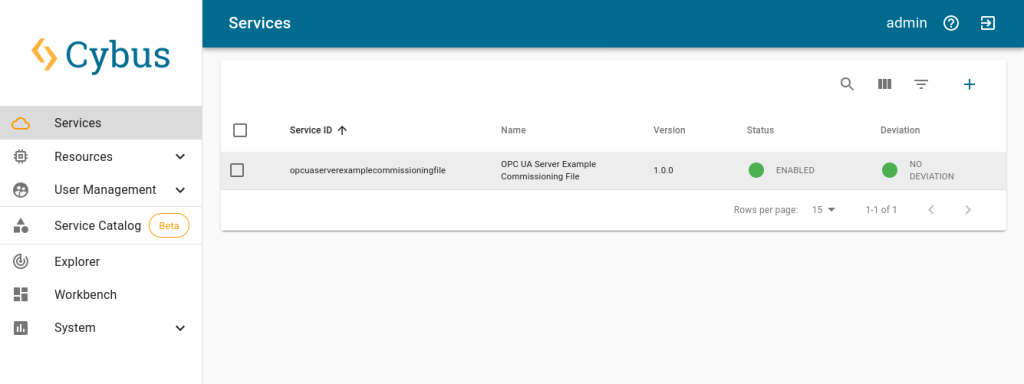
You now have the commissioning file ready for installation. Go to the Services tab in the Connectware Admin UI and click the (+) button to select and upload the commissioning file. After confirming this dialog, the service will be installed. On enabling the service, all the resources we just defined will be created: The OPC UA server, the server nodes and the mapping. Once the service has been successfully enabled, you can go ahead and see if everything works.
Now that our OPC UA server is running, we can go to the Explorer tab, where the tree structure of our newly created endpoints can be seen and the endpoints can be inspected. Hover over an entry and select the eye icon on the right – this activates the live view.
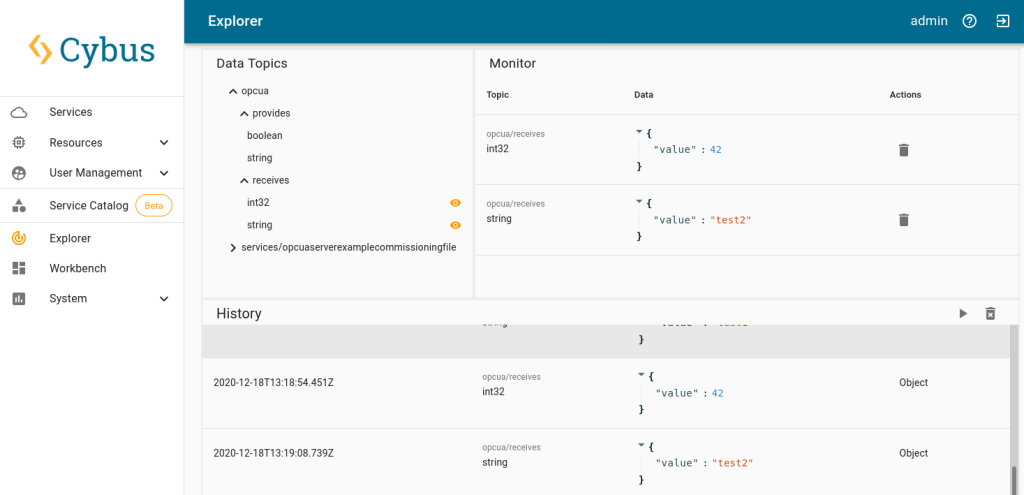
We can now use the OPC UA client to connect to our server on port 4841. Since we configured it to accept anonymous clients, we can just go ahead. If we wanted to allow access only to registered users, we would create them in the Connectware user management. But for now, after connecting to our OPC UA server anonymously, we can send data to the receiving variable nodes. In the Explorer view we can then see this data being published on the MQTT topics, on which we mapped the OPC UA variable nodes.
Additionally utilizing an MQTT client, we could now subscribe to this data or also publish data on the topic which is mapped on the providing variable nodes to send it to OPC UA clients. An easy way to experiment with these possibilities is the Workbench. There you can also easily configure MQTT nodes for quick prototyping. See our other articles to learn more about the Workbench.
Setting up an OPC UA server with a service commissioning file is quite simple. To adjust the server to suit your needs, the configuration with the commissioning file offers various additional options which are described in the Connectware Docs. Being integrated into Connectware, this OPC UA server can also be directly connected to the protocol mapper and through it to systems using other protocols.
Connectware offers powerful features to build and deploy applications for gathering, filtering, forwarding, monitoring, displaying, buffering, and all kinds of processing data… why not build a dashboard, for instance? For guidance, read more on Cybus Learn.
This article describes how to integrate your Azure IoT Hub with Connectware. It will help you configure the necessary Connectware service commissioning file and provide examples of mapping data from Connectware to Azure IoT Hub and vice versa. In addition, the article links to helpful tools to help you work with Azure IoT Hub and implement your use cases faster.
As described in the official Azure documentation, Azure IoT Hub supports communication via MQTT. There are two ways to communicate with the IoT Hub device endpoints:
In this article, we will focus on connecting via TCP port 8883, which is the standard secure communication port for MQTT and is the preferred integration of Azure IoT Hub with Connectware.
To access Azure IoT Hub, we need some connection properties that we add as definitions (i.e. constant values) to our commissioning file.
For now, do not worry about copying the commissioning file snippets together into one, we provide you with a link to the complete example file at the end.
definitions:

  iotHubHostname: <full CName of your Azure IoT Hub>
  mqttPort: 8883
  deviceId: <Your deviceID>
  sasToken: <Your generated SAS Token>
Code-Sprache: YAML (yaml)To connect to Azure IoT Hub, we set up a Cybus::Connection resource in the resources section. The connection uses the general MQTT connector from Connectware. For an overview of the connection properties, refer to MQTT (Cybus documentation).
With the !ref tag we reference the definitions from our previous step. The username is a string composed of the iotHubHostname and the deviceId, to concatenate strings we need the !sub tag. With this tag in place, we can include the definitions within the string by enclosing them in curly brackets and a preceding $.
resources:
  mqttConnection:
    type: Cybus::Connection
    properties:
      protocol: Mqtt
      connection:
        host: !ref iotHubHostname
        port: !ref mqttPort
        username: !sub "${iotHubHostname}/${deviceId}/?api-version=2021-04-12"
        password: !ref sasToken
        clientId: !ref deviceId
        scheme: tls
        keepalive: 3600
Code-Sprache: YAML (yaml)
This is all we need to establish the initial connection to Azure IoT Hub. Now let’s define our read endpoint.
If the Connectware host system does not have access to root CAs, you may need to add the Azure root certificate to your configuration using the caCert property. For more information on Azure root certificates, refer to the Azure documentation.
You can connect to a specific endpoint on Azure IoT Hub. To write data from Connectware to Azure IoT Hub, the topic is defined by Azure IoT Hub. For more information on this, refer to the Azure documentation.
  # Device to Cloud
  d2cEndpoint:
    type: Cybus::Endpoint
    properties:
      protocol: Mqtt
      connection: !ref mqttConnection
      topic: d2cEndpoint
      qos: 0
      write:
        topic: !sub "devices/${deviceId}/messages/events/"
Code-Sprache: YAML (yaml)To read data from Azure IoT Hub, we need another endpoint. In this case, we subscribe to a wildcard topic to receive all data for the device ID we are connected to. Note that this topic is already defined by Azure IoT Hub.
  # Cloud to Device
  c2dEndpoint:
    type: Cybus::Endpoint
    properties:
      protocol: Mqtt
      connection: !ref mqttConnection
      topic: c2dEndpoint
      subscribe:
        topic: !sub "devices/${deviceId}/messages/devicebound/#"
Code-Sprache: YAML (yaml)Here are two example mappings that route topics from Connectware to the endpoints we configured before. Replace the topic Azure/IoTHub/Write with the topic where you want to publish the data to be sent to Azure IoT Hub. In the second mapping, replace Azure/IoTHub/Read with the topic where you want to access the data that comes from Azure IoT Hub.
  deviceToCloudMapping:
    type: Cybus::Mapping
    properties:
      mappings:
        - subscribe:
            topic: Azure/IoTHub/Write
          publish:
            endpoint: !ref d2cEndpoint

  cloudToDeviceMapping:
    type: Cybus::Mapping
    properties:
      mappings:
        - subscribe:
            endpoint: !ref c2dEndpoint
          publish:
            topic: Azure/IoTHub/Read
Code-Sprache: YAML (yaml)There are some helpful tools that are suitable for prototyping or exploring the data on your Azure IoT Hub within Visual Studio Code. These tools should help you to implement your use cases faster.
The Workbench service that comes with Connectware is a Node-RED instance that runs securely inside Connectware as a service. This allows you to install any Node-RED nodes within the service container for quick prototyping.
Important: We do not recommend using Node-RED in production instances as we cannot guarantee reliability. This should only be considered as a rapid-prototyping tool.
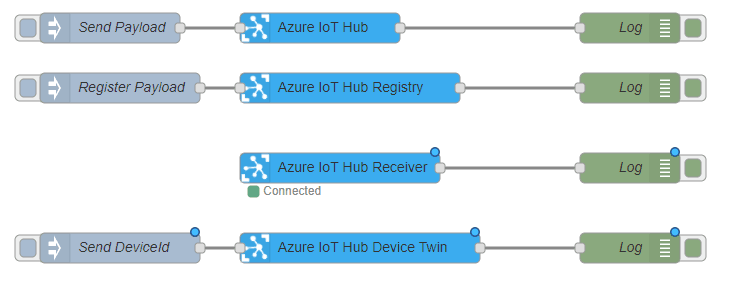
node-red-contrib-azure-iot-hub is a Node-RED module that allows you to send messages and register devices with Azure IoT Hub. It includes a total of four Node-RED cloud nodes: Azure IoT Hub, Azure IoT Registry, Azure IoT Hub Receiver, and Azure IoT Hub Device Twin. For more information on the module, refer to Node-Red.
Azure IoT Tools is a collection of Visual Studio Code extensions for working with Azure IoT Hub. With these extensions, you can interact with an Azure IoT Hub instance, manage connected devices, and enable distributed tracing for your IoT Hub applications. You can also subscribe to telemetry messages sent to the IoT Hub for quick testing.
For more information on installing and using Azure IoT tools, refer to the Visual Studio Marketplace.
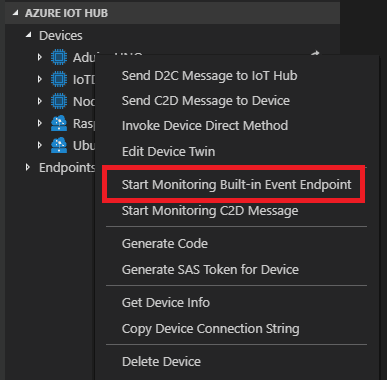
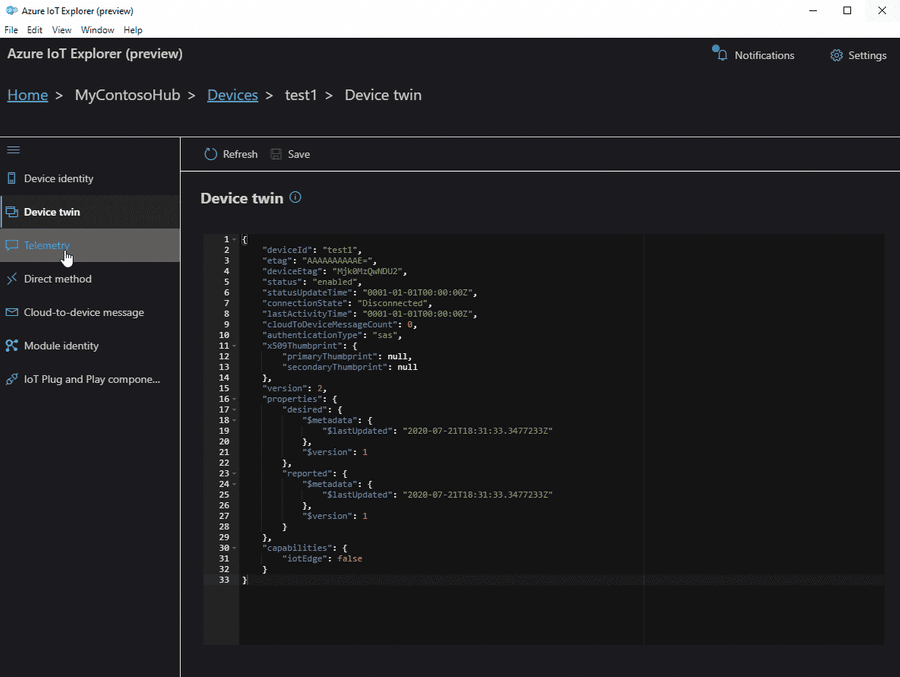
Azure IoT Explorer is an open source cross-platform user interface for interacting with Azure IoT Hub without logging into the Azure portal. This tool can be used to perform tasks like creating, deleting, and querying devices within the IoT Hub. Device functions such as sending and receiving telemetry, and editing device and module twin configuration are also possible with this tool.
For more information on Azure IoT Explorer, refer to GitHub.
In this lesson, we will send data from the Connectware MQTT Broker to AWS IoT.
It is required to set up a Connectware instance and at least one AWS IoT Device. In case of using AWS IoT at the edge, an AWS IoT Greengrass Core has to be set up.
We assume you are already familiar with Connectware and its service concept. If not, we recommend reading the articles Connectware Technical Overview and Service Basics for a quick introduction. Furthermore, this lesson requires basic understanding of MQTT and how to publish data on an MQTT topic. If you want to refresh your MQTT knowledge, we recommend the lessons MQTT Basics and How to connect an MQTT client to publish and subscribe data.
This article is divided into three parts.
First, it provides general information about AWS IoT services and their differences. Feel free to skip this section if you are familiar with AWS IoT and the differences between AWS IoT Core and IoT Greengrass.
Then, the current integration mechanisms between Connectware and the AWS IoT are explained through a hands-on approach.
Finally, the article describes the tools to work with your MQTT use case to prototype, review and monitor the integration scenario.
AWS IoT is a managed cloud platform that lets connected devices interact easily and securely with cloud applications and other devices. AWS IoT practically supports a nearly unlimited number of devices and messages, and can process and route those messages to AWS endpoints and to other devices reliably and securely.
For AWS IoT, Amazon offers a software development kit available for most popular programming languages and platforms.
AWS IoT Core is the main component to manage devices, their certificates, shadows, Greengrass resources and integration rules to subsequent AWS resources like IoT Analytics. It also offers ways to audit and test your IoT use cases.
AWS IoT Greengrass extends AWS Cloud resources to edge devices, so they can act locally on the generated data, while still using the cloud for management, analytics, and durable storage. It is possible for connected devices to interact with AWS Lambda functions and Docker containers, execute predictions based on machine learning models, keep device data in sync, and communicate with other devices – even when not connected to the Internet.
Greengrass has the following advantages:
Although in many scenarios these advantages are very significant, one could also mention some drawbacks to make the picture more complete:
Before proceeding further, first set up AWS IoT Core (and AWS IoT Greengrass for an edge deployment) by following the respective instructions:
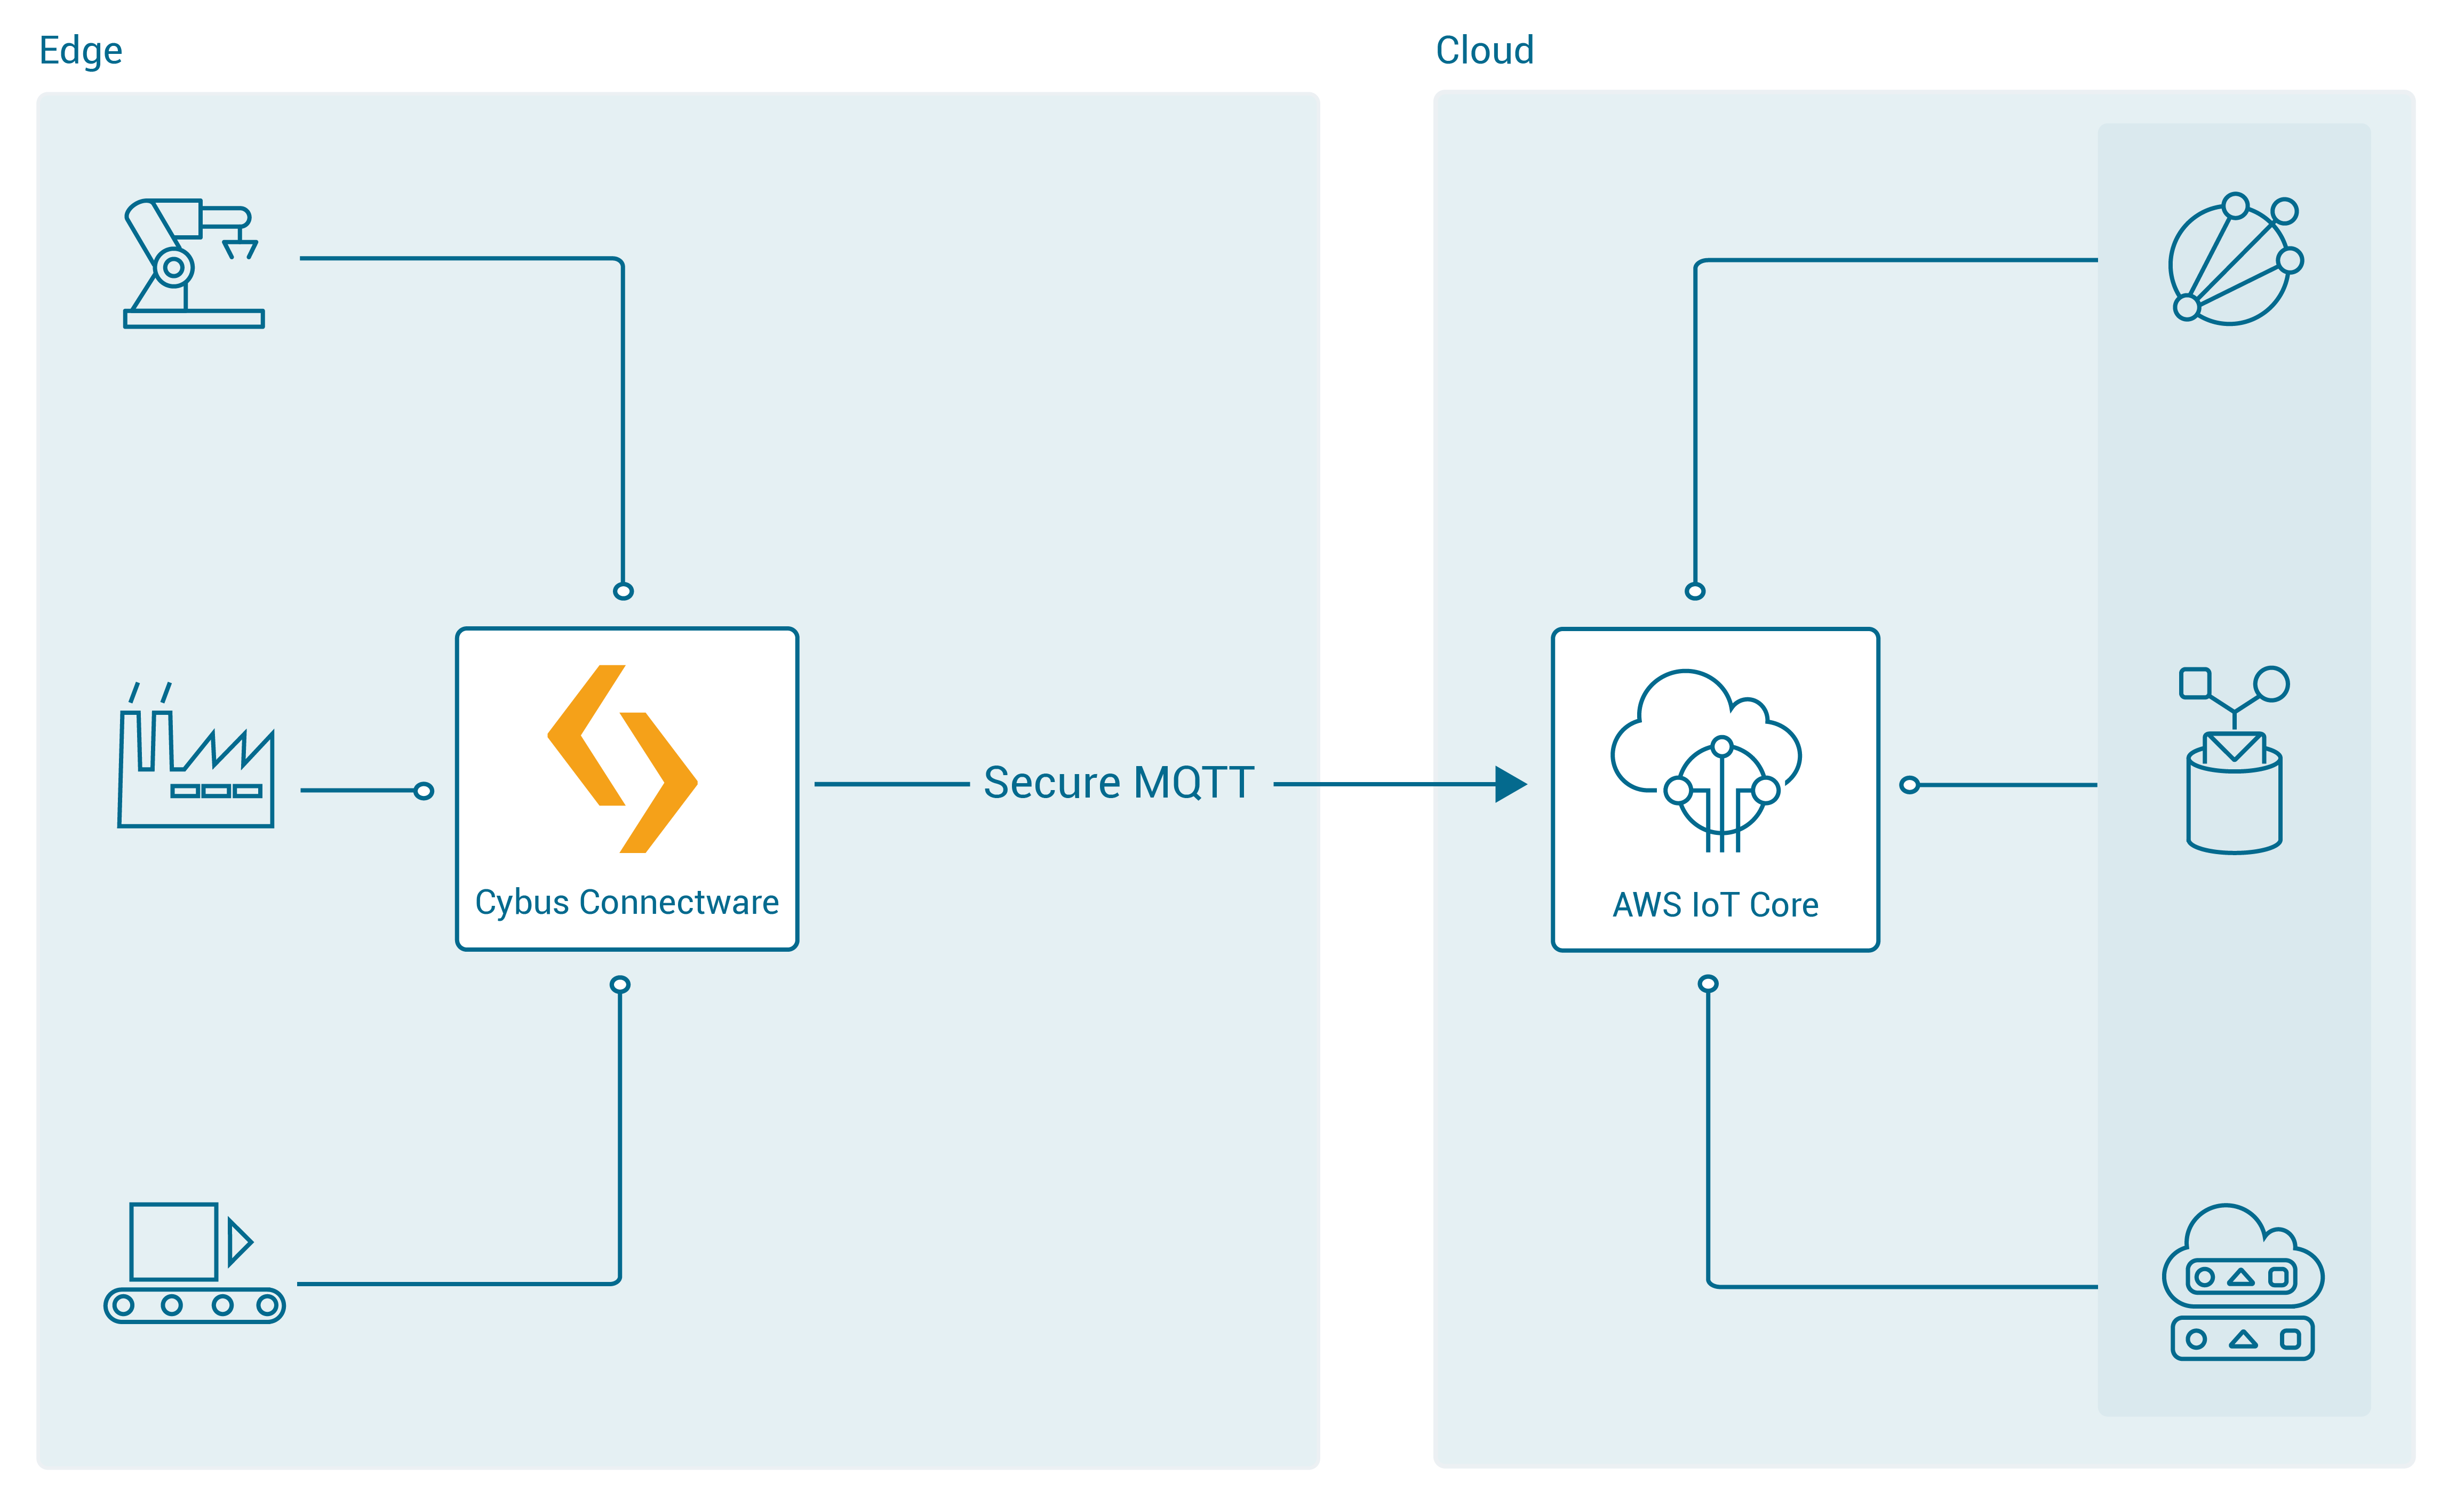
To integrate AWS IoT with Cybus Connectware, the built-in MQTT connector with TLS support is the simplest, most reliable and secure way of communication. For a successful AWS IoT integration, Connectware does not require more than that. As an additional advantage, the Connectware MQTT connector has also data buffering built-in, so that data is stored locally when there is a temporary connection failure with AWS IoT Core or Greengrass Core.
There can be two integration scenarios.
In the first integration scenario, the Connectware connects directly to the AWS cloud:
In the second integration scenario, the Connectware is connected to Greengrass Core, which is meant to be deployed as a gateway to the AWS cloud next to the Connectware IIoT Edge Gateway:
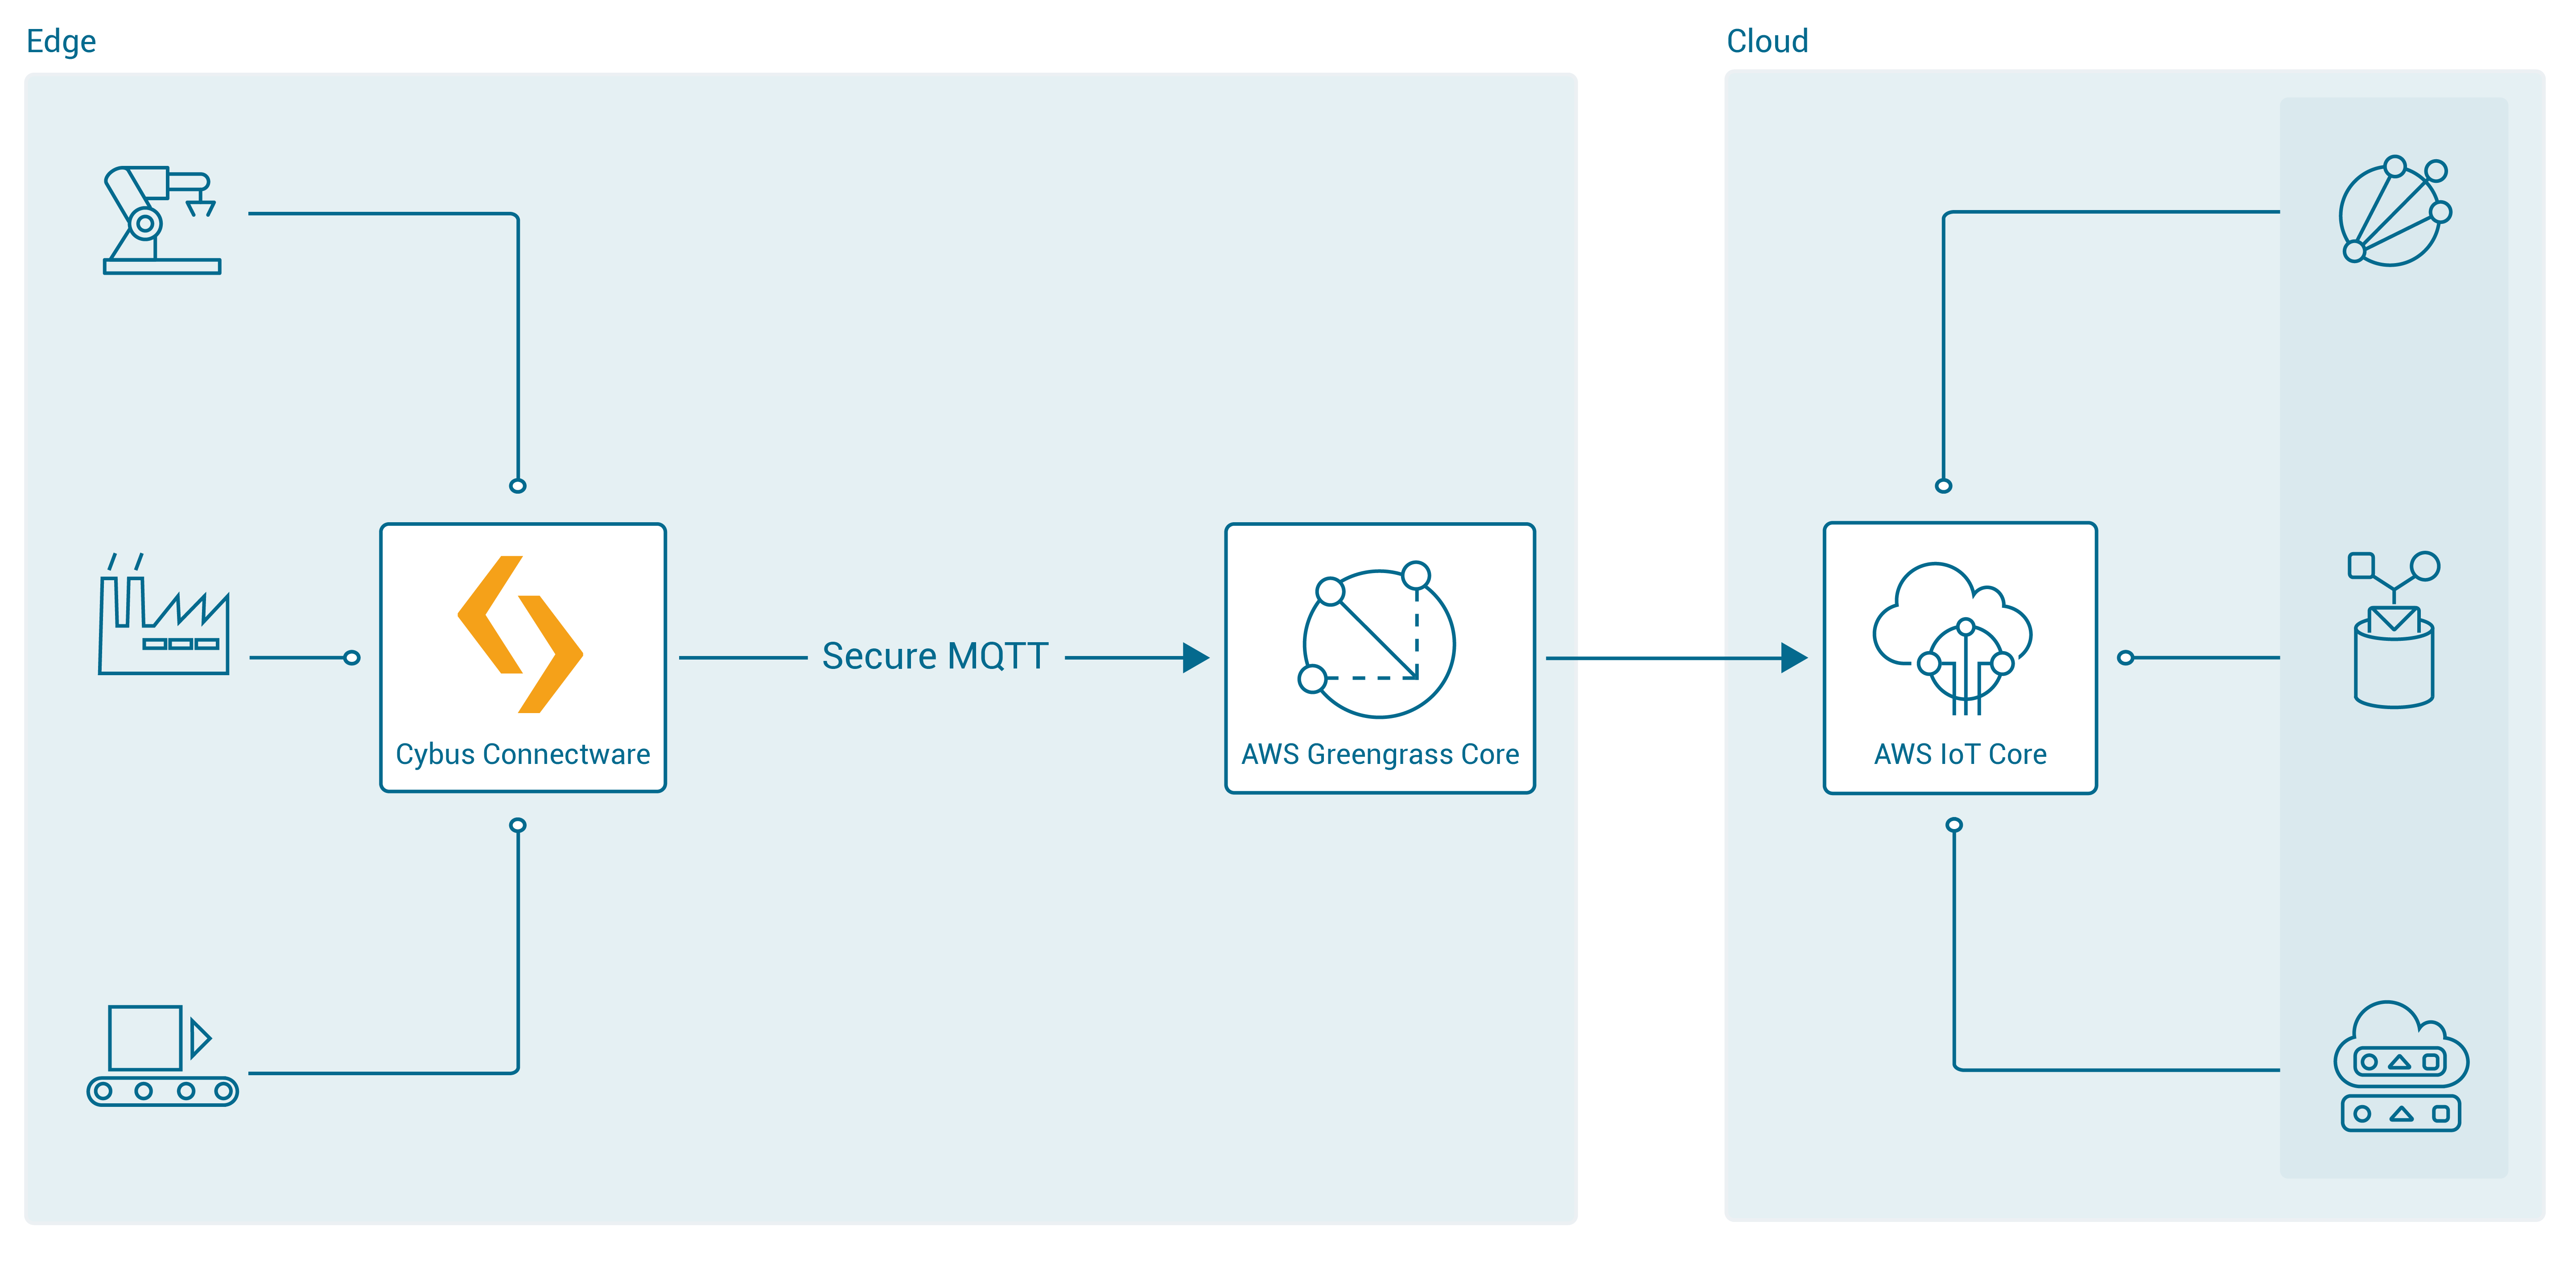
For AWS IoT connections using the Connectware, the following has to be configured:
For details on how to get this information, see the article How to connect AWS IoT and Greengrass. Use the example below to implement a simple AWS IoT service transmitting any data structure in the selected MQTT topic.
The definitions part requires PEM formatted certificates:
You may then configure Endpoint and Mapping resources following the Cybus resource documentation.
The commissioning file below sends any data published on topics ${Cybus::MqttRoot}/test/#topic to AWS IoT into topics TestDevice/$topic with a simple transformation rule.
Make sure you are publishing data on the Connectware broker on the respective topic. The placeholder ${Cybus::MqttRoot} represents the root topic defined as services/<serviceId> after the service is successfully started. The notation #topic/$topic represents a wildcard mapping from any topic name used in subscribe to the same topic name in publish, which has the effect of an MQTT bridge with applied rules like the transformation in the example.
Further details on MQTT topic transformations can be found in the article How to connect an MQTT client to publish and subscribe data.
description: >
  Cybus Connectware to AWS IoT Core
metadata:
  name: AWS IoT Core Test
  version: 1.0.0
  provider: cybus
  homepage: https://www.cybus.io

parameters:
  Aws_IoT_Endpoint_Address:
    type: string
    description: The ATS endpoint to reach your AWS account's AWS IoT Core
    default: <your-aws-account-endpoint-id>-ats.iot.eu-central-1.amazonaws.com

definitions:

  # The root CA certificate as PEM format (AmazonRootCA1.pem)
  caCert: |
    -----BEGIN CERTIFICATE-----
    -----END CERTIFICATE-----
  # The device certificate in PEM CRT format
  clientCert: |
    -----BEGIN CERTIFICATE-----
    -----END CERTIFICATE-----
  # The device private key in PEM format
  clientPrivateKey: |
    -----BEGIN RSA PRIVATE KEY-----
    -----END RSA PRIVATE KEY-----

resources:

  awsMqttConnection:
    type: Cybus::Connection
    properties:
      protocol: Mqtt
      connection:
        host: !ref Aws_IoT_Endpoint_Address
        port: 8883
        scheme: mqtts
        clientId: !sub "${Cybus::ServiceId}-awsMqttConnection"
        mutualAuthentication: true
        caCert: !ref caCert
        clientCert: !ref clientCert
        clientPrivateKey: !ref clientPrivateKey

  sourceTargetMapping:
    type: Cybus::Mapping
    properties:
      mappings:
        - subscribe:
            topic: !sub "${Cybus::MqttRoot}/test/#topic"
          publish:
            connection: !ref awsMqttConnection
            topic: TestDevice/$topic
          rules:
            - transform:
                expression: |
                  (
                    {
                      "deviceId": "TestDevice",
                      "payload": $
                    }
                  )
Code-Sprache: YAML (yaml)In order to connect to a Greengrass Core, the example service commissioning file needs several changes:
See the article How to connect AWS IoT and Greengrass about how to get the Greengrass Group Certificate Authority.
parameters:
...
  awsGreengrassClientId:
    type: string
    default: TestDeviceEdge
...
resources:
  greengrassTestDeviceEdgeMqttConnection:
    type: Cybus::Connection
    properties:
      protocol: Mqtt
      connection:
        host: !ref Greengrass_Core_Endpoint_Address
        port: 8883
        scheme: mqtts
        clientId: !ref awsGreengrassClientId
        mutualAuthentication: true
        caCert: !ref caCert
        clientCert: !ref clientCert
        clientPrivateKey: !ref clientPrivateKey
...
Code-Sprache: YAML (yaml)To implement or maintain a new IIoT Edge integration use case as fast and reliable as possible, there are suitable tools for working with MQTT, Connectware and AWS IoT.
The AWS CLI generally helps with any task on AWS. In this case we have at least two tasks being most efficiently completed using the CLI:
1) Find out the AWS IoT ATS endpoint defined for your AWS account:
aws iot describe-endpoint --endpoint-type iot:Data-ATS
Code-Sprache: YAML (yaml)
The response contains the AWS account specific ATS (Amazon Trust Services) endpoint address to be used as the MQTT hostname:
{
   "endpointAddress": "a7t9...1pi-ats.iot.eu-central-1.amazonaws.com"
}
Code-Sprache: YAML (yaml)
2) Get the Greengrass Group Certificate Authority certificate in case of using AWS IoT Greengrass. You then need the following for the caCert setting in the service commissioning file instead of the Amazon Root CA:
aws greengrass list-groups
aws greengrass list-group-certificate-authorities --group-id "4824ea5c-f042-42be-addc-fcbde34587e7"
aws greengrass get-group-certificate-authority --group-id "4824ea5c-f042-42be-addc-fcbde34587e7"
--certificate-authority-id "3e60c373ee3ab10b039ea4a99eaf667746849e3fd87940cb3afd3e1c8de054af"
Code-Sprache: YAML (yaml)
The JSON Output of the latter call has a field PemEncodedCertificate containing the requested information which needs to be set as the caCert parameter similar to this:
-----BEGIN CERTIFICATE-----
MIIC1TCCAb2gAwIBAgIJANXVxedsqvdKMA0GCSqGSIb3DQEBBQUAMBoxGDAWBgNVBAMTD3d3dy5leGFtcGxlLmNvbTAeFw0yMDEwMDUwNTM4MzRaFw0zMDEwMDMwNTM4MzRaMBoxGDAWBgNVBAMTD3d3dy5leGFtcGxlLmNvbTCCASIwDQYJKoZIhvcNAQEBBQADggEPADCCAQoCggEBAM/0NrS45cm0ovF3+8q8TUzj+E3UH8ldnJJPCQFGMaL+7PoxbO0fYf3ETkEW+dijIZOfus9dSPX7qBDbfilz/HtNppGDem4IjgC52iQl3B1R7TvU8yLNliv43uDDUd+PkzW1cWbUuykr5QPG2sIDSANukosvRdFKO4ydP0Hr9iUdOfbg4k6hMFCrzJubKQqhcBTSsxGtl78abx0Q49shuWr9RRjzqE6mRFa4h0DrKBstgAfmsDRGm4ySBCM7lwxphSsoejb6l39WI/MNU7/U7cGj26ghWHAWp8VCksBOqma8tmr/0BuqcCgKJYaDr1tf4SVxlwU20K+jz0pphdEwSj0CAwEAAaMeMBwwGgYDVR0RBBMwEYIPd3d3LmV4YW1wbGUuY29tMA0GCSqGSIb3DQEBBQUAA4IBAQBkcKC3cgHJGna6OxA5QM3dGM5pEiSXyZt5HWoW8z6wUlYtir6U+mWIb9yg7zaSy9nUOqU4sizQh1HG/Mq9K2WbflGafvfN0wW16uyINdjcfGYDh43UDkXHr5Xzky5XIgt0Fx4BWmjgbLYsza7qpbeIg5ekUYPYQw1Ic2sNpyncmS0eutg4tAO7uzDu1x84WPcZzUjDHKYfupuDXkWroPnHTAxlJ6vtgW976c3Z5rQ5l8bUysWhLBEM8q2OP/zmGDo7fpUHYOKo5qU4h7vGD3t0Pb4ufPOd7XtHuY6HsI2cAPV3tpuetHH6wyAQTG9luhdYrZjAp+ZvlwBm+9nXYp/Y
-----END CERTIFICATE-----
Code-Sprache: YAML (yaml)The Workbench service is basically a Node-RED application running securely on the Connectware as a service. This opens up the possibility to install any Node-RED nodes within the service container for quick prototyping as well as for the production environment. If your use-case cannot be achieved with the above service commissioning file, using the workbench will give you some flexibility and additional tools to prototype your solution using Node-RED modules.
In case of AWS IoT, MQTT connection is enough for most integration scenarios. You may use simple injection nodes and some random value generator in order to implement and test the use northbound to AWS IoT:
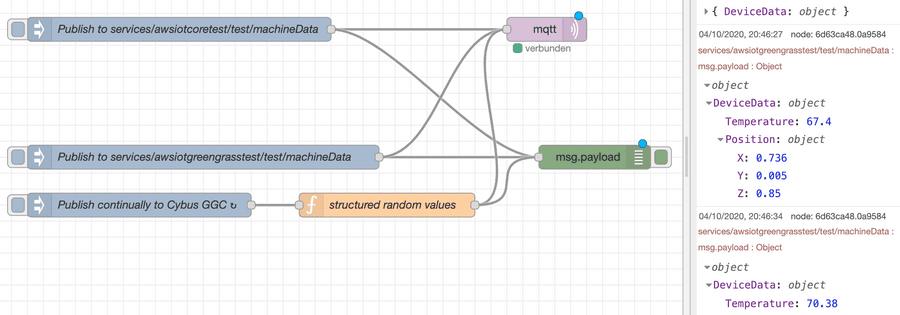
If there are other requirements such as working with shadow devices and other AWS resources, e.g. as part of the IoT Greengrass Core deployment, you may want to use additional Node-RED modules supporting AWS.
If it comes to more complex data management and handling, you may want to use the AWS IoT Device SDK to create a specific Connector Service for Connectware to cover your requirements.
In most cases, it is enough to process any kind of device data and apply rules to them on the Connectware as the most powerful edge gateway tool. Similar capabilities can be used on the near-cloud gateway AWS IoT Greengrass or AWS IoT Core itself to manage rules and transformations near the shadow devices definitions.
What works best depends on your business strategy and technical constraints.
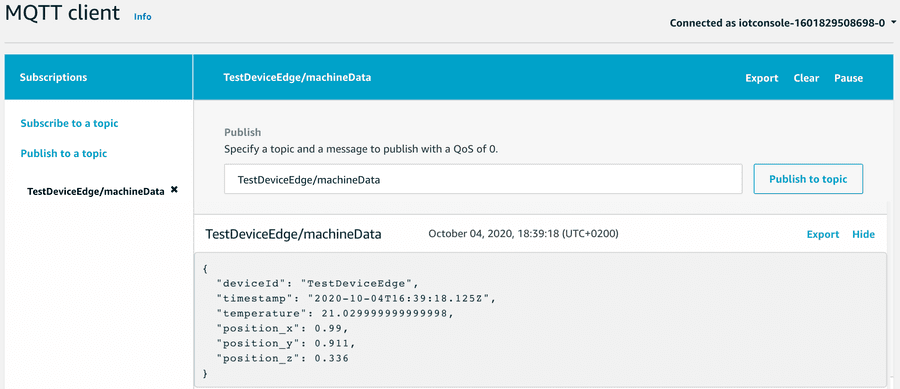
Now that we are successfully sending the data to the IoT Core, we can monitor the transmitted data using various AWS resources.
The obvious tool is the AWS IoT Core MQTT Client offered on the AWS IoT console. With this tool you regularly subscribe to your topic defined in the service commissioning file for outgoing data:
In order to make use of AWS resources, you define AWS IoT rules and define actions appropriately, e.g. transmission to IoT Analytics and a DynamoDB table:
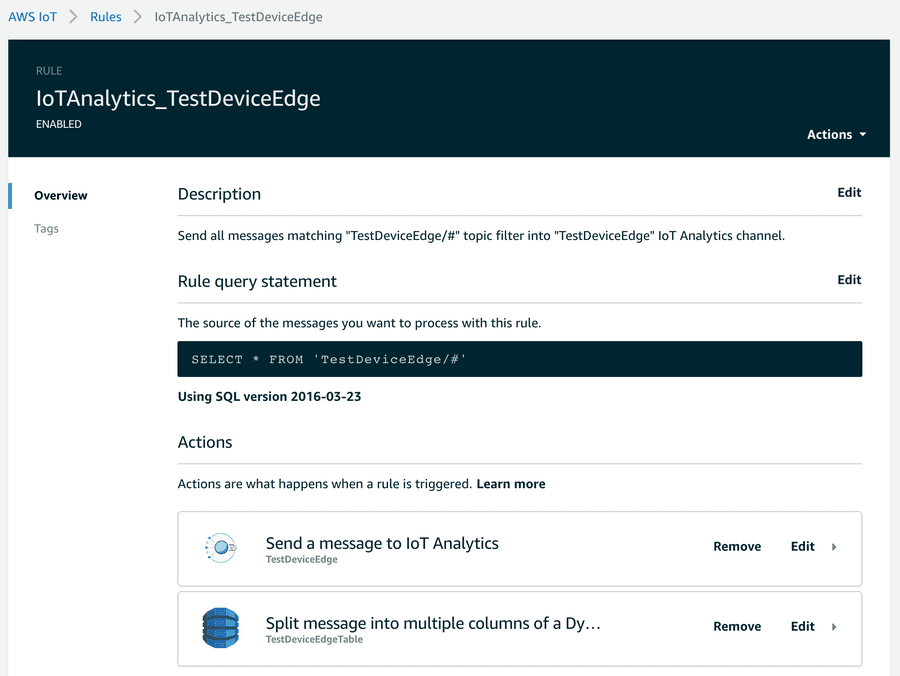
The AWS IoT Console helps to quickly implement data transfer to these endpoints.
An example of how to work with these resources could be a change to the transformation mentioned above to better meet the requirements using the fast and easy mapping support of the Connectware. Given a requirement to flatten an original data object injected into the internal topic, you can easily transform that data using a Connectware transformation rule using Jsonata:
Given a structured object:
"DeviceData": {
    "Temperature": <decimal>,
    "Position": {
        "X": <decimal>,
        "Y": <decimal>,
        "Z": <decimal>
    }
}
Code-Sprache: YAML (yaml)
As an example, the above mentioned mapping could be then enhanced for flattening the elements and adding a timestamp:
  sourceTargetMapping:
...
          rules:
            - transform:
                expression: |
                  (
                    {
                      "deviceId": "TestDeviceEdge",
                      "payload": $
                    }
                  )
            - transform:
                expression: |
                  (
                    {
                      "deviceId": "TestDeviceEdge",
                      "timestamp": $now(),
                      "temperature": $.payload.DeviceData.Temperature,
                      "position_x": $.payload.DeviceData.Position.X,
                      "position_y": $.payload.DeviceData.Position.Y,
                      "position_z": $.payload.DeviceData.Position.Z
                    }
                  )
Code-Sprache: YAML (yaml)
After implementing the use case, you may see the options to shorten things a bit. Connectware then plays its strength with fast integration processes near the connected devices, where most of the data pre-processing can be realized with low latency and fewer costs before transmitting it to the cloud.
The enhanced transformation rule within Connectware mentioned above may be inspired by a requirement to write the data in a well-structured database:
Or the requirement was to create some graph with Amazon Quicksight:
If it comes to the AWS Cloud, there is a vast amount of resources that can be useful to create your IoT Application. You should especially have a look at lambda functions that could be deployed to your IoT Greengrass Core instance.
Other new tools like AWS IoT SiteWise or AWS IoT Things Graph may be useful to build your IoT applications faster with easier management and monitoring.
This lesson first offered a brief introduction to AWS IoT and its components available for integration with other services. Then it explained how to send data from the Connectware MQTT Broker to AWS IoT Core or Greengrass Core with a simple commissioning file using the built-in MQTT connector of Connectware. Furthermore, the Cybus workbench service for prototyping more advanced scenarios was presented. The lesson finished with a description of some basic and advanced tools used to monitor data flow between AWS IoT and Connectware.
MQTT as an open network protocol and OPC UA as an industry standard for data exchange are the two most common players in the IIoT sphere. Often, MQTT (Message Queuing Telemetry Transport) is used to connect various applications and systems, while OPC UA (Open Platform Communications Unified Architecture) is used to connect machines. Additionally, there are also applications and systems that support OPC UA, just as there are machines or devices that support MQTT. Therefore, when it comes to providing communication between multiple machines/devices and applications that support different protocols, a couple of questions might arise. First, how to bridge the gap between the two protocols, and second, how to do it in an efficient, sustainable, secure and extensible way.
This article discusses the main aspects of MQTT and OPC UA and illustrates how these protocols can be combined for IIoT solutions. The information presented here would thus be useful for IIoT architects.
Both protocols are the most supported and most utilized in the IIoT. MQTT originated in the IT sphere and is supported by major IoT cloud providers, such as Azure, AWS, Google, but also by players specialized in industrial use cases, e.g. Adamos, Mindsphere, Bosch IoT, to name a few. The idea behind MQTT was to invent a very simple yet highly reliable protocol that can be used in various scenarios (for more information on MQTT, see MQTT Basics). OPC UA, on the contrary, was created by an industry consortium to boost interoperability between machines of different manufacturers. As MQTT, this protocol covers core aspects of security (authentication, authorization and encryption of the data) and, besides, meets all essential industrial security standards.
IIoT use cases are complex, because they bring together two distinct environments – Information Technology (IT) and Operational Technology (OT). Traditionally, the IT and OT worlds were separated from each other, had different needs and thus developed very different practices. One of such dissimilarities is the dependence on different communication protocols. The IT world is primarily influenced by higher level applications, web technology and server infrastructure, so the adoption of MQTT as an alternative to HTTP is on the rise there. At the same time, in the OT world, OPC UA is the preferable choice due to its ability of providing a perfectly described interface to industrial equipment.
Today, however, the IT and OT worlds gradually converge as the machine data generated on the shopfloor (OT) is needed for IIoT use cases such as predictive maintenance or optimization services that run in specialized IT applications and often in the cloud. Companies can therefore benefit from combining elements from both fields. For example, speaking of communication protocols, they can use MQTT and OPC UA along with each other. A company can choose what suits well for its use case’s endpoint and then bridge the protocols accordingly. If used properly, the combination of both protocols ensures greatest performance and flexibility.
As already mentioned above, applications usually rely on MQTT and machines on OPC UA. However, it is not always that straightforward. Equipment may also speak MQTT and MES systems may support OPC UA. Some equipment and systems may even support both protocols. On top of that, there are also numerous other protocols apart from MQTT and OPC UA. All this adds more dimensions to the challenge of using data in the factory.
This IIoT challenge can, however, be solved with the help of middleware. The middleware closes the gap between the IT and OT levels, it enables and optimises their interaction. The Cybus Connectware is such a middleware.
The Cybus Connectware supports a broad variety of protocols – including MQTT and OPC UA – and thus makes it possible to connect nearly any sort of IT application with nearly any sort of OT equipment. In the case of OPC UA and MQTT, the bridging of two protocols is achieved through connecting four parties: OPC UA Client, OPC UA Server, MQTT Client and MQTT Broker. The graphic below illustrates how the Cybus Connectware incorporates these four parties.
On the machines layer, different equipment can be connected to Connectware. For example, if a device such as a CNC controller (e.g. Siemens SINUMERIK) that uses OPC UA should be connected, then Connectware will serve as the OPC UA Client and the controller as the OPC UA Server. While connecting a device that supports MQTT (e.g. a retrofit sensor), Connectware will act as the MQTT broker, and the sensor will be the MQTT client.
Likewise, various applications can be connected to Connectware on the applications layer. In case of connecting services that support MQTT (e.g. Azure IoT Hub or AWS IoT / Greengrass), Connectware will act as the MQTT client, while those services will act as MQTT brokers. If connecting systems that support OPC UA (e.g. MES), Connectware will play the role of the OPC UA Server, while the systems will act as OPC UA clients.
The question may arise as to why not connect applications or systems that support a specific protocol directly to devices that support the same protocol, e.g. a SINUMERIK machine controller to a MES (which both “speak” OPC UA), or a retrofit sensor to the Azure IoT Hub (which both can communicate via MQTT)? Although this is theoretically possible, in practice it comes with fundamental disadvantages that can quickly become costly problems. A tightly coupled system like this requires far more effort as well as in depth protocol and programming skills. Such a system is then cumbersome to administer and not scalable. Most importantly, it lacks agility when introducing changes such as adding new data sources, services or applications. Thus a “pragmatic” 1:1 connectivity approach actually slows down the IIoT responsibles’ ability for business enablement where it is really needed to accelerate.
At this point, it is worth moving from the very detailed example of MQTT and OPC UA to a broader picture, because IIoT is a topic full of diversity and dynamics.
In contrast to the 1:1 connectivity approach, the Connectware IIoT Edge Platform enables (m)any-to-(m)any connectivity between pretty much any OT and IT data endpoints. From a strategic point of view, Connectware, acting as a “technology-neutral layer”, provides limitless compatibility in the IIoT ecosystem while maintaining convenient independence from powerful providers and platforms. It provides a unified, standardised and systematic environment that is made to fit expert users’ preferences. On this basis, IIoT responsibles can leverage key tactical benefits such as data governance, workflow automation and advanced security. You can read more about these aspects and dive into more operational capabilities in related articles.
Sie müssen den Inhalt von reCAPTCHA laden, um das Formular abzuschicken. Bitte beachten Sie, dass dabei Daten mit Drittanbietern ausgetauscht werden.
Mehr InformationenSie sehen gerade einen Platzhalterinhalt von Turnstile. Um auf den eigentlichen Inhalt zuzugreifen, klicken Sie auf die Schaltfläche unten. Bitte beachten Sie, dass dabei Daten an Drittanbieter weitergegeben werden.
Mehr InformationenSie sehen gerade einen Platzhalterinhalt von Facebook. Um auf den eigentlichen Inhalt zuzugreifen, klicken Sie auf die Schaltfläche unten. Bitte beachten Sie, dass dabei Daten an Drittanbieter weitergegeben werden.
Mehr InformationenSie sehen gerade einen Platzhalterinhalt von HubSpot. Um auf den eigentlichen Inhalt zuzugreifen, klicken Sie auf die Schaltfläche unten. Bitte beachten Sie, dass dabei Daten an Drittanbieter weitergegeben werden.
Mehr InformationenSie sehen gerade einen Platzhalterinhalt von Hubspot Meetings. Um auf den eigentlichen Inhalt zuzugreifen, klicken Sie auf die Schaltfläche unten. Bitte beachten Sie, dass dabei Daten an Drittanbieter weitergegeben werden.
Mehr InformationenSie sehen gerade einen Platzhalterinhalt von Instagram. Um auf den eigentlichen Inhalt zuzugreifen, klicken Sie auf die Schaltfläche unten. Bitte beachten Sie, dass dabei Daten an Drittanbieter weitergegeben werden.
Mehr InformationenSie sehen gerade einen Platzhalterinhalt von X. Um auf den eigentlichen Inhalt zuzugreifen, klicken Sie auf die Schaltfläche unten. Bitte beachten Sie, dass dabei Daten an Drittanbieter weitergegeben werden.
Mehr Informationen