kubectl installed (Install Tools).kubectl configured with the current context pointing to your target cluster (Configure Access to Multiple Clusters).Add the Cybus connectware-helm repository to your local Helm installation to use the connectware-agent Helm chart to install Connectware agents in Kubernetes:
helm repo add cybus https://repository.cybus.io/repository/connectware-helm
Code-Sprache: YAML (yaml)
To verify that the Helm chart is available you can execute a Helm search:
helm search repo connectware-agent
Code-Sprache: YAML (yaml)| NAME | CHART VERSION | APP VERSION | DESCRIPTION |
| cybus/connectware-agent standalone agents | 1.0.0 | 1.1.5 | Cybus Connectware |
As with all Helm charts, the connectware-agent chart is configured using a YAML file. This file can have any name, however we will refer to it as the values.yaml file.
Create this file to start configuring your agent installation by using your preferred editor:
vi values.yaml
Code-Sprache: YAML (yaml)To quickly install a single agent you only need to add your Connectware license key to your values.yaml file as the Helm value licenseKey:
licenseKey: <your-connectware-license-key>
Code-Sprache: YAML (yaml)
You can now use this file to deploy your Connectware agent in a Kubernetes namespace of your choice:
helm upgrade -i connectware-agent cybus/connectware-agent -f values.yaml -n <namespace>
Code-Sprache: YAML (yaml)
Output
Release "connectware-agent" does not exist. Installing it now.

NAME: connectware-agent

LAST DEPLOYED: Mon Mar 13 14:31:39 2023

NAMESPACE: connectware

STATUS: deployed

REVISION: 1

TEST SUITE: None

NOTES:

Thank you for using the Cybus Connectware agent Helm chart!

For additional information visit https://cybus.io/

Number of agents: 1

--------------------

- agent

If any of these agents are new, please remember to visit Connectware's client registry to set up the connection to Connectware.

Hint: If you have agents stuck in a status other than "Running", you need to delete the stuck pods before a pod with your new configuration will be created.
Code-Sprache: YAML (yaml)
This will start a single Connectware agent named “agent”, which will connect to a Connectware installation deployed in the same namespace. Unlock the Client Registry in your Connectware admin UI to connect this agent. Refer to Client Registry — Connectware documentation to learn how to use the Client Registry to connect agents.
You can repeat the same command to apply any changes to your values.yaml file configuration in the future.
If you are not deploying the agent in the same Kubernetes namespace, or even inside the same Kubernetes cluster, you need to specify the hostname under which Connectware is reachable for this agent.
In the default configuration, the following network ports on Connectware must be reachable for the agent:
Specify the hostname of Connectware to which the agent connects to by setting the Helm value connectwareHost inside the protocolMapperAgentDefaults context of your values.yaml file. For Connectware deployments in a different Kubernetes namespace this is “connectware.<namespace>”.
Example
licenseKey: <your-connectware-license-key>
protocolMapperAgentDefaults:
  connectwareHost: connectware.cybus # adjust to actual hostname of Connectware
Code-Sprache: YAML (yaml)To connect to a Connectware that uses the separate control-plane-broker, you need to set the Helm value controlPlaneBrokerEnabled to true inside the protocolMapperAgentDefaults section of your values.yaml file.
Example
licenseKey: <your-connectware-license-key>
protocolMapperAgentDefaults:
  connectwareHost: connectware.cybus # adjust to actual hostname of Connectware
  controlPlaneBrokerEnabled: true
Code-Sprache: YAML (yaml)
Note: This adds TCP/1884 to required network ports.
You can use the agent chart to install multiple Connectware agents. Every agent you configure needs to be named using the Helm value name in a collection entry inside the context protocolMapperAgents. This way, the default name “agent” will be replaced by the name you give the agent.
Example
licenseKey: <your-connectware-license-key>
protocolMapperAgentDefaults:
  connectwareHost: connectware.cybus # adjust to actual hostname of Connectware
protocolMapperAgents:
- name: bender-robots
- name: welder-robots
Code-Sprache: YAML (yaml)
This will deploy two Connectware agents, named “bender-robots” and “welder-robots”, both of which will contact the Client Registry of Connectware inside the Kubernetes namespace “cybus”, as described in Client Registry — Connectware documentation
In this lesson we will walk you through all the measures necessary to be taken so PRTG is able to connect to a remote Docker socket.
As a prerequisite, it is necessary to have Docker installed on your system as well as an instance of PRTG with access to that host.
We assume you have at least a basic understanding of Docker and Linux. If you want to refresh your knowledge, we recommend looking at the lesson Docker Basics.
Explaining Linux would be far out of scope for this lesson, but it’s likely an answer to any Linux related question is out there on the internet. Anyway, if you read carefully, the listed commands should work with only minor adjustments.
Monitoring your IT infrastructure has a lot of benefits, discovering bottlenecks and gaining insights for predictive measures being only the tip of the iceberg.
PRTG is a solid monitoring solution already present and actively used in a lot of IT departments. Because there are a lot of different monitoring solutions out there, this article is targeted to be compatible with the way PRTG handles Docker Container Monitoring.
PRTG requires the Docker Socket to be exposed to the network, which is not the case on a default setup. The reason for the port not being exposed by default is because of security reasons.
An exposed and unsecured port could lead to a major security issue! Whoever is able to connect to the docker socket could easily gain full control on the system – meaning root access.
Therefore it is really important to handle these configurations with care. The measurement we are going to take is to secure the remote access by using TLS certificates. You can read more about this in the Docker docs.
A guide on the PRTG Docker Container Sensor can be found here.
First of all we need to create a bunch of certificates. There are basically two options for doing this.
We are going to use the second option, which means all certificates are going to be self-signed, but that’s totally fine for the purpose of this lesson.
All instructions for the creation of the certificates can be found in the docker docs. To simplify this a little bit, we created a small script that executes all the commands for you.
All the steps below assume you are going to use the script. The script is non-interactive, meaning you do not have to enter anything during execution. The generated certificates won’t be password protected and are valid for 50 years.
Create a directory called .docker in your home directory. This directory is the default directory where the Docker CLI stores all its information.
$ mkdir -p ~/.docker
Code-Sprache: YAML (yaml)
Clone the script into the previously created directory.
$ git clone https://gist.github.com/6f6b9a85e136b37cd52983cb88596158.git ~/.docker/
Code-Sprache: YAML (yaml)
Change into the directory.
$ cd ~/.docker/
Code-Sprache: YAML (yaml)
Make the script executable.
$ chmod +x genCerts.sh
Code-Sprache: YAML (yaml)
Then we need to adjust a few things within the script.
$ nano genCerts.sh
Code-Sprache: YAML (yaml)
Adjust the HOST to match your hostname and the last IP of the HOSTS string to match your host ip address.
This is how it looks for my setup.
HOST="cybus.io"
HOSTS="DNS:$HOST,IP:127.0.0.1,IP:172.16.0.131"
Code-Sprache: YAML (yaml)
Now we are ready to execute the script.
$ sh genCerts.sh
Code-Sprache: YAML (yaml)
The output should be somewhat like this.
# Start

# Generate CA private and public keys
Generating RSA private key, 4096 bit long modulus (2 primes)
.................................................................................................................................................................................................................................................................................................................................................................................................................................................................................................++++
...............++++
e is 65537 (0x010001)

Create a server key
Generating RSA private key, 4096 bit long modulus (2 primes)
.++++
..........................................................................++++
e is 65537 (0x010001)

Create certificate signing request

Sign the public key with CA
Signature ok
subject=CN = cybus.io
Getting CA Private Key

Create a client key and certificate signing request
Generating RSA private key, 4096 bit long modulus (2 primes)
.................................................................................................................................++++
...............................................................................................................................................................................................................................................................................................................++++
e is 65537 (0x010001)

Make the key suitable for client authentication

Generate the signed certificate
Signature ok
subject=CN = client
Getting CA Private Key

Remove the two certificate signing requests and extensions config
removed 'client.csr'
removed 'server.csr'
removed 'extfile.cnf'
removed 'extfile-client.cnf'
Code-Sprache: YAML (yaml)
To verify all certificates have been generated successfully we inspect the content of the directory.
$ ls
Code-Sprache: YAML (yaml)
These files should be present. If there are more files than this, that’s no issue.
ca-key.pem  ca.pem  ca.srl  cert.pem  genCerts.sh  key.pem  server-cert.pem  server-key.pem
Code-Sprache: YAML (yaml)
The last step is to locate the full path to where the certificates live.
$ pwd
Code-Sprache: YAML (yaml)
This is the output in my case. Yours will look a little bit different.
/home/jan/.docker
Code-Sprache: YAML (yaml)With all the necessary certificates in place, we have to assign them to the docker daemon. We can find the location of the configuration file by checking the status of the docker service.
$ sudo systemctl status docker.service
Code-Sprache: YAML (yaml)
As stated in the output, the configuration file is located at /lib/systemd/system/docker.service
● docker.service - Docker Application Container Engine
       Loaded: loaded (/lib/systemd/system/docker.service; enabled; vendor preset: enabled)
       Active: active (running) since Mon 2022-05-02 10:26:56 EDT; 33s ago
  TriggeredBy: ● docker.socket
       Docs: https://docs.docker.com   Main PID: 468 (dockerd)
        Tasks: 9
       Memory: 109.2M
          CPU: 307ms     CGroup: /system.slice/docker.service
               └─468 /usr/bin/dockerd -H fd:// --containerd=/run/containerd/containerd.sock
Code-Sprache: YAML (yaml)
To adjust the configuration to our needs, we are going to open the configuration using sudo privileges.
$ sudo nano /lib/systemd/system/docker.service
Code-Sprache: YAML (yaml)
Find the line starting with ExecStart=/usr/bin/dockerd -H fd:// and add the following content to it. Be sure to use the correct path for your setup.
-H tcp://0.0.0.0:2376 --tlsverify=true --tlscacert=/home/jan/.docker/ca.pem --tlscert=/home/jan/.docker/server-cert.pem --tlskey=/home/jan/.docker/server-key.pem
Code-Sprache: YAML (yaml)
For me the complete line looks like this.
ExecStart=/usr/bin/dockerd -H fd:// -H tcp://0.0.0.0:2376 --tlsverify=true --tlscacert=/home/jan/.docker/ca.pem --tlscert=/home/jan/.docker/server-cert.pem --tlskey=/home/jan/.docker/server-key.pem --containerd=/run/containerd/containerd.sock
Code-Sprache: YAML (yaml)
Flush the changes and restart the docker service.
$ sudo systemctl daemon-reload
$ sudo systemctl restart docker
Code-Sprache: YAML (yaml)
Now we can verify our changes did take effect.
$ sudo systemctl status docker.service
Code-Sprache: YAML (yaml)
● docker.service - Docker Application Container Engine
Loaded: loaded (/lib/systemd/system/docker.service; enabled; vendor preset: enabled)
Active: active (running) since Tue 2022-05-03 04:56:12 EDT; 2min 32s ago
TriggeredBy: ● docker.socket
Docs: https://docs.docker.com
Main PID: 678 (dockerd)
Tasks: 9
Memory: 40.8M
CPU: 236ms
CGroup: /system.slice/docker.service
└─678 /usr/bin/dockerd -H fd:// -H tcp://0.0.0.0:2376 --tlsverify=true --tlscacert=/home/jan/.docker/ca.pem --tlscert=/home/jan/.docker/server-cert.pem --tlskey=/home/jan/.docker/server-key.pem --containerd=/run/containerd/containerd.sock
Code-Sprache: YAML (yaml)Now we can use the Docker CLI to connect to the Docker Daemon using the specified port. The important part is to use –tlsverify=true as this tells the Docker CLI to use the generated certificates located in our home directory ( ~/.docker).
Remember to adjust the IP address in the second line with your individual one.
$ docker -H 127.0.0.1:2376 --tlsverify=true version
$ docker -H 172.16.0.131:2376 --tlsverify=true version
Code-Sprache: YAML (yaml)
This is the output of both commands on my system.
Client: Docker Engine - Community
Version:           20.10.14
API version:       1.41
Go version:        go1.16.15
Git commit:        a224086
Built:             Thu Mar 24 01:48:21 2022
OS/Arch:           linux/amd64
Context:           default
Experimental:      true

Server: Docker Engine - Community
Engine:
  Version:          20.10.14
  API version:      1.41 (minimum version 1.12)
  Go version:       go1.16.15
  Git commit:       87a90dc
  Built:            Thu Mar 24 01:46:14 2022
  OS/Arch:          linux/amd64
  Experimental:     false
containerd:
  Version:          1.5.11
  GitCommit:        3df54a852345ae127d1fa3092b95168e4a88e2f8
runc:
  Version:          1.0.3
  GitCommit:        v1.0.3-0-gf46b6ba
docker-init:
  Version:          0.19.0
  GitCommit:        de40ad0
Code-Sprache: YAML (yaml)The last and final step is to install the docker sensor inside of PRTG. This should be fairly easy to accomplish by following the provided instructions from https://www.paessler.com/manuals/prtg/docker_container_status_sensor.
In this lesson we will set up a local Cybus Connectware Instance using Ansible.
As a prerequisite, it is necessary to have Ansible, Docker and Docker Compose installed on your system as well as a valid Connectware License on hand.
Docker shouldn’t be installed using snapcraft!
We assume you are already familiar with Cybus Connectware and its service concept. If not, we recommend reading the articles Connectware Technical Overview and Service Basics for a quick introduction. Furthermore this lesson requires basic understanding of Docker and Ansible. If you want to refresh your knowledge, we recommend looking at the lesson Docker Basics and this Ansible Getting started guide.
Ansible is an open-source provisioning tool enabling infrastructure as code. Cybus provides a set of custom modules (Collection) exclusively developed to manage every part of a Connectware Deployment, seamlessly integrated into the Ansible workflow. With only a few lines of code you can describe and roll out your whole infrastructure, including services, users and many more.
The collection provides the following modules:
First of all we have to make sure that the Connectware Ansible Collection is present on our system. The Collection is available for Download on Ansible Galaxy.
Installing the Collection is fairly easy by using Ansible Tools:
$ ansible-galaxy collection install cybus.connectware
Code-Sprache: YAML (yaml)
To get a list of all installed collections you can use the following command:
$ ansible-galaxy collection list
Code-Sprache: YAML (yaml)
If you already have installed the collection you can force an update like this:
$ ansible-galaxy collection install cybus.connectware --force
Code-Sprache: YAML (yaml)To provide Ansible with all the information that is required to perform the Connectware installation, we need to write a short playbook. Create a empty folder and a file called playbook.yaml with the following content:
- name: Connectware Deployment
  hosts: localhost

  tasks:
    - name: Deploy Connectware
      cybus.connectware.instance:
        license: ***
        install_path: ./
Code-Sprache: YAML (yaml)
Taking the file apart we define one play named Connectware Deployment which will be executed on the given hosts. The only host in our case is the localhost.
Then we define all the tasks to be executed. We only have one task called Deploy Connectware. The task takes a module to be executed along with some configuration parameters. For now we only specify parameters for the licence and the install_path. Make sure to replace the *** with your actual licence key. The install_path will be the one you created your playbook in.
There are a lot more parameters to use with this module, but the only required one is license. To see a full list use this command:
$ ansible-doc cybus.connectware.instance
Code-Sprache: YAML (yaml)
For running the playbook open a shell in the newly created folder and execute this command (execution may take a few minutes):
$ ansible-playbook playbook.yaml
Code-Sprache: YAML (yaml)
The output should look somewhat similar to this.
Notice that the state of the Deploy Connectware task is marked as changed. This indicates that the Connectware is now running and is reachable at https://localhost.
Beside the log output you should now find two new files beside the playbook.yaml. One file is the actual docker compose file managing the Connectware Containers and the other one is holding some additional configurations.
[WARNING]: No inventory was parsed, only implicit localhost is available
[WARNING]: provided hosts list is empty, only localhost is available. Note that the implicit localhost does not match 'all'

PLAY [Connectware Deployment] ***************************************************************************

TASK [Gathering Facts] ***************************************************************************
ok: [localhost]

TASK [Deploy Connectware] ***************************************************************************
changed: [localhost]

PLAY RECAP ***************************************************************************
localhost: ok=2    changed=1    unreachable=0    failed=0    skipped=0    rescued=0    ignored=0
Code-Sprache: YAML (yaml)
If you like you can rerun the exact same command, which will result in no operation, since the Connectware already has the desired state. As you can see, this time there is no changed state.
$ ansible-playbook playbook.yaml
[WARNING]: No inventory was parsed, only implicit localhost is available
[WARNING]: provided hosts list is empty, only localhost is available. Note that the implicit localhost does not match 'all'

PLAY [Connectware Deployment] ***************************************************************************

TASK [Gathering Facts] ***************************************************************************
ok: [localhost]

TASK [Deploy Connectware] ***************************************************************************
ok: [localhost]

PLAY RECAP ***************************************************************************
localhost                  : ok=2    changed=0    unreachable=0    failed=0    skipped=0    rescued=0    ignored=0
Code-Sprache: YAML (yaml)Now that we have a running Cybus Connectware instance, we go a step further and install a Service. First thing we have to do is to create the Service Commissioning File. We will use a very simple Service for demonstration purposes. Create a file called example-service.yml and paste in the following content:
---
description: Example Service

metadata:
  name: example_service

resources:

  mqttConnection:
    type: Cybus::Connection
    properties:
      protocol: Mqtt
      connection:
        host: !ref Cybus::MqttHost
        port: !ref Cybus::MqttPort
        scheme: mqtt
        username: !ref Cybus::MqttUser
        password: !ref Cybus::MqttPassword
Code-Sprache: YAML (yaml)
There is really not much going on here than simply creating a connection to the internal Connectware Broker.
Next we have to enrich our playbook by appending another task like this:
    - name: Install Service
      cybus.connectware.service:
        id: example_service
        commissioning_file: ./example-service.yml
Code-Sprache: YAML (yaml)
The task uses another module of the collection for managing services. The required parameters are id and commissioning_file.
You can learn more about the module by using this command:
$ ansible-doc cybus.connectware.service
Code-Sprache: YAML (yaml)
When executing the playbook again, you should see similar output to this:
$ ansible-playbook playbook.yaml
[WARNING]: No inventory was parsed, only implicit localhost is available
[WARNING]: provided hosts list is empty, only localhost is available. Note that the implicit localhost does not match 'all'

PLAY [Connectware Deployment] ***************************************************************************

TASK [Gathering Facts] ***************************************************************************
ok: [localhost]

TASK [Deploy Connectware] ***************************************************************************
ok: [localhost]

TASK [Install Service] ***************************************************************************
changed: [localhost]

PLAY RECAP ***************************************************************************
localhost: ok=3    changed=1    unreachable=0    failed=0    skipped=0    rescued=0    ignored=0
Code-Sprache: YAML (yaml)
When visiting the Connectware UI Services page you should now see the service being installed and enabled (https://localhost/admin/#/services).
Every module supports different states. The default state of the instance module for example is started. To stop the Connectware we define another task, use the instance module and define the state to be stopped.
    - name: Stopping Connectware
      cybus.connectware.instance:
        state: stopped
        license: ***
        install_path: ./
Code-Sprache: YAML (yaml)
After executing the playbook once more, the Cybus Connectware should no longer be running.
All the steps described above are really basic and there is so much more to learn and discover.
The recommended next steps are:
This quick start guide describes the steps to install the Cybus Connectware onto a Kubernetes cluster.
Please consult the article Installing Cybus Connectware for the basic requirements to run the software, like having access to the Cybus Portal to acquire a license key.
The following topics are covered by this article:
We assume that you are already familiar with the Cybus Portal and that you have obtained a license key or license file. Also see the prerequisites in the article Installing Cybus Connectware.
This guide does not introduce Kubernetes, Docker, containerization or tooling knowledge, we expect the system admin to know about their respective Kubernetes environment, which brings – besides wellknown standards – a certain specific custom complexity, e.g. the choice of certain load balancers, the management environment, storage classes and the like, which are up to the customer’s operations team and should not affect the reliability of Cybus Connectware deployed there, if the requirements are met.
Besides a Kubernetes cluster the following tools and resources are required:
To be able to start with Cybus Connectware on a Kubernetes cluster, use the prepared helm chart and the following steps:
helm repo add cybus https://repository.cybus.io/repository/connectware-helm
Code-Sprache: YAML (yaml)helm repo update
helm search repo connectware [-l]
Code-Sprache: YAML (yaml)values.yaml. This file will be used to configure your installation of Connectware. Initially fill this file with this YAML content:global:
licensekey: <YOUR-CONNECTWARE-LICENSE-KEY>
setImmutableLabels: true
broker:
clusterSecret: <SOME-RANDOM-SECRET-STRING>
Code-Sprache: YAML (yaml)ReadWriteOnce and ReadWriteMany access modes, please also set the value global.storage.storageClassName to a StorageClass that does the following:storage:
storageClassName: “san-storage” # example value
Code-Sprache: YAML (yaml)default-values.yaml and checking if you want to make further adjustments. It is, for example, possible that you need to adjust the resource request/limit values for smaller test clusters. In this case copy and adjust the global.podResources section from default-values.yaml to values.yaml.helm show values cybus/connectware > default-values.yaml
Code-Sprache: YAML (yaml)helm install <YOURDEPLOYMENTNAME> cybus/connectware -f ./values.yaml --dry-run --debug -n<YOURNAMESPACE> --create-namespace
Code-Sprache: YAML (yaml)Example
helm install connectware cybus/connectware -f ./values.yaml --dry-run --debug -ncybus --create-namespace
Code-Sprache: YAML (yaml)helm install <YOURDEPLOYMENTNAME> cybus/connectware -f ./values.yaml --n<YOURNAMESPACE> --create-namespace
Code-Sprache: YAML (yaml)helm upgrade <YOURDEPLOYMENTNAME> cybus/connectware -f ./values.yml -n<YOURNAMESPACE>
Code-Sprache: YAML (yaml)When taking a look at the default-values.yaml file you should check out these important values within the global section:
licensekey value handles the licensekey of the Connectware installation. This needs to be a production license key. This parameter is mandatory unless you set licenseFilelicenseFile value is used to activate Connectware in offline mode. The content of a license file downloaded from the Cybus Portal has to be set (this is a single line of a base64 encoded json object)image source and version using the image section. broker section specifies MQTT broker related settings:
broker.clusterSecret: the authentication secret for the MQTT broker cluster. Note: The cluster secret for the broker is not a security feature. It is rather a cluster ID so that nodes do not connect to different clusters that might be running on the same network. Make sure that the controlPlaneBroker.clusterSecret is different from the broker.clusterSecret.broker.replicaCount: the number of broker instancescontrolPlaneBroker section specifies MQTT broker related settings:
controlPlaneBroker.clusterSecret: the authentication secret for the MQTT broker cluster. Note: The cluster secret for the broker is not a security feature. It is rather a cluster ID so that nodes do not connect to different clusters that might be running on the same network. Make sure that the controlPlaneBroker.clusterSecret is different from the broker.clusterSecret.controlPlaneBroker.replicaCount: the number of broker instancescontrolPlaneBroker is optional. To activate it, type controlPlaneBroker.enabled: true. This creates a second broker cluster that handles only internal communications within Connectware.loadBalancer section allows pre-configuration for a specific load balancerpodResources set of values allows you to configure the number of CPU and memory resources per pod; by default some starting point values are set, but depending on the particular use case they need to be tuned in relation to the expected load in the system, or reduced for test setupsprotocolMapperAgents section allows you to configure additional protocol-mapper instances in Agent mode. See the documentation below for more detailsHelm allows setting values by both specifying a values file (using -f or --values) and the --set flag. When upgrading this chart to newer versions you should use the same arguments for the Helm upgrade command to avoid conflicting values being set for the Chart; this is especially important for the value of global.broker.clusterSecret, which would cause the nodes not to form the cluster correctly, if not set to the same value used during install or upgrade.
For more information about value merging, see the respective Helm documentation.
After following all the steps above Cybus Connectware is now installed. You can access the Admin UI by opening your browser and entering the Kubernetes application URL https://<external-ip> with the initial login credentials:
Username: admin
Password: admin
To determine this data, the following kubectl command can be used:
kubectl get svc connectware --namespace=<YOURNAMESPACE> -o jsonpath={.status.loadBalancer.ingress}
Code-Sprache: YAML (yaml)
Should this value be empty your Kubernetes cluster load-balancer might need further configuration, which is beyond the scope of this document, but you can take a first look at Connectware by port-forwarding to your local machine:
kubectl --namespace=<YOURNAMESPACE> port-forward svc/connectware 10443:443 1883:1883 8883:8883
Code-Sprache: YAML (yaml)
You can now access the admin UI at: https://localhost:10443/
If you would like to learn more how to use Connectware, check out our docs at https://docs.cybus.io/ or see more guides here.
The Kubernetes version of Cybus Connectware comes with a Helm Umbrella chart, describing the instrumentation of the Connectware images for deployment in a Kubernetes cluster.
It is publicly available in the Cybus Repository for download or direct use with Helm.
Cybus Connectware expects a regular Kubernetes cluster and was tested for Kubernetes 1.22 or higher.
This cluster needs to be able to provide load-balancer ingress functionality and persistent volumes in ReadWriteOnce and ReadWriteMany access modes provided by a default StorageClass unless you specify another StorageClass using the global.storage.storageClassName Helm value.
For Kubernetes 1.25 and above Connectware needs a privileged namespace or a namespace with PodSecurityAdmission labels for warn mode. In case of specific boundary conditions and requirements in customer clusters, a system specification should be shared to evaluate them for secure and stable Cybus Connectware operations.
Connectware specifies default limits for CPU and memory in its Helm values that need to be at least fulfilled by the Kubernetes cluster for production use. Variations need to be discussed with Cybus, depending on the specific demands and requirements in the customer environment, e.g., the size of the broker cluster for the expected workload with respect to the available CPU cores and memory.
Smaller resource values are often enough for test or POC environments and can be adjusted using the global.podResources section of the Helm values.
In order to run Cybus Connectware in Kubernetes clusters, two new RBAC roles are deployed through the Helm chart and will provide Connectware with the following namespace permissions:
| resource(/subresource)/action | permission |
|---|---|
| pods/list | list all containers get status of all containers |
| pods/get pods/watch | inspect containers |
| statefulsets/list | list all StatefulSets get status of all StatefulSets |
| statefulsets/get statefulsets/watch | inspect StatefulSets |
| resource(/subresource)/action | permission |
|---|---|
| pods/list | list all containers get status of all containers |
| pods/get pods/watch | inspect containers |
| pods/log/get pods/log/watch | inspect containers get a stream of container logs |
| deployments/create | create Deployments |
| deployments/delete | delete Deployments |
| deployments/update deployments/patch | to restart containers (since we rescale deployments) |
The system administrator needs to be aware of certain characteristics of the Connectware deployment:
licenseFile above)global.loadBalancer.addressPoolName or by setting the metallb.universe.tf/address-pool annotation using the global.ingress.service.annotations Helm valueThe default-values.yaml file contains a protocolMapperAgents section representing a list of Connectware agents to deploy. The general configuration for these agents is the same as described in the Connectware documentation.
You can copy this section to your local values.yaml file to easily add agents to your Connectware installation
The only required property of the list items is name; if only this property is specified the chart assumes some defaults:
nameconnectware which is the DNS name of Connectware.storageSize is set to 40 MB by default. The agents use some local storage which needs to be configured based on each use case. If a larger number of services is going to be deployed, this value should be specified and set to bigger values.You can check out the comments of that section in default-values.yaml to see further configuration options.
You can find further information in the general Connectware Agent documentation.
In this lesson, we will send data from Cybus Connectware to an Elasticsearch Cluster.
As a prerequisite, it is necessary to set up the Connectware instance and the Elasticsearch instance to be connected. In case of joining a more advanced search infrastructure, a Logstash instance between Connectware and the Elasticsearch cluster may be useful.
We assume you are already familiar with Cybus Connectware and its service concept. If not, we recommend reading the articles Connectware Technical Overview and Service Basics for a quick introduction. Furthermore, this lesson requires basic understanding of MQTT and how to publish data on an MQTT topic. If you want to refresh your MQTT knowledge, we recommend looking at the lessons MQTT Basics and How to connect an MQTT client to publish and subscribe data.
This article provides general information about Elasticsearch and its role in the Industrial IoT context along with a hands-on section about the Cybus Connectware integration with Elasticsearch.
If you are already familiar with Elasticsearch and its ecosystem, jump directly to the hands-on section. See: Using Filebeat Docker containers with Cybus Connectware.
The article concludes by describing some aspects of working with relevant use cases for prototyping, design decisions and reviewing the integration scenario.
Elasticsearch is an open-source enterprise-grade distributed search and analytics engine built on Apache Lucene. Lucene is a high-performance, full-featured text search engine programming library written in Java. Since its first release in 2010, Elasticsearch has become widely used for full-text search, log analytics, business analytics and other use cases.
Elasticsearch has several advantages over classic databases:
Mastering these features is a known challenge, since working with Elasticsearch and search indices in general can become quite complex depending on the use case. The operational effort is also higher, but this can be mitigated by using managed Elasticsearch clusters offered by different cloud providers.
Elasticsearch inherently comes with a log aggregator engine called Logstash, a visualization and analytics platform called Kibana and a collection of data shippers called Beats. These four products are part of the integrated solution called the “Elastic Stack”. Please follow the links above to learn more about it.
When it comes to Industrial IoT, we speak about collecting, enriching, normalizing and analyzing huge amounts of data ingested at a high rate even in smaller companies. This data is used to gain insights into production processes and optimize them, to build better products, to perform monitoring in real time, and last but not least, to establish predictive maintenance. To benefit from this data, it needs to be stored and analyzed efficiently, so that queries on that data can be made in near real time.
Here a couple of challenges may arise. One of them could be the mismatch between modern data strategies and legacy devices that need to be integrated into an analytics platform. Another challenge might be the need to obtain a complete picture of the production site, so that many different devices and technologies can be covered by an appropriate data aggregation solution.
Some typical IIoT use cases with the Elastic Stack include:
Elastic Stack has become one of several solutions for realizing such use cases in a time and cost efficient manner, and the good thing is that Elasticsearch can be easily integrated into the shop floor with Cybus Connectware.
Cybus Connectware is an ideal choice for this because its protocol abstraction layer is not only southbound protocol agnostic, supporting complex shop floor environments with many different machines, but also agnostic to the northbound systems. This means that customers can remain flexible and realize various use cases according to their specific requirements. For example, migrating a Grafana-based local monitoring system to Kibana, an Elastic Stack-based real time monitoring Dashboard, is a matter of just a few changes.
The learning curve for mastering Elasticsearch is steep for users who try it for the first time. Maintaining search indices and log shippers can also be complex for some use cases. In those cases, it might be easier and more efficient to integrate machines into an IIoT edge solution, such as Connectware.
Here are some benefits of using Cybus Connectware at the edge to stream data to Elasticsearch:
Nevertheless, when ingesting data the Filebeat and Logstash data processing features may also be very useful for normalizing data for all data sources, not just IIoT data from OT networks.
Before proceeding further, you should first obtain access credentials for an existing Elasticsearch cluster, or set up a new one. For this, follow the instructions below:
The simplest and most reliable way of communication when integrating Cybus Connectware with Elasticsearch is the MQTT Input for a Filebeat instance. An additional advantage of the Connectware MQTT connector is built-in data buffering, which means that data is stored locally when there is temporary connection failure between the Filebeat and the Elasticsearch Cluster:
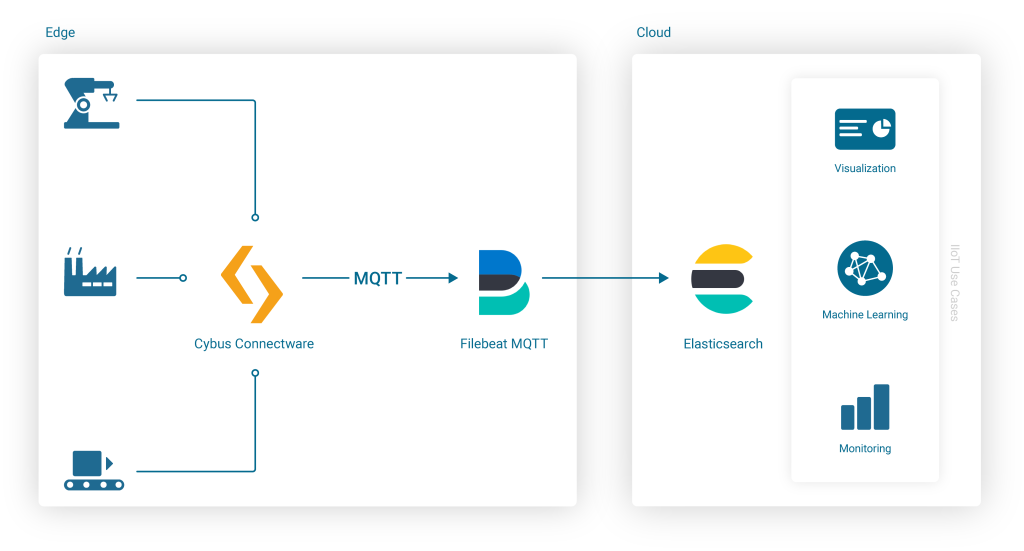
Embedding the Filebeat Docker Image into Connectware is easy because Connectware comes with an integrated interface for running Edge Applications. Once started, the docker container connects to the integrated Connectware Broker to fetch and process the data of interest.
All you have to do is to create a Connectware Service by writing a Commissioning File and install it on the Connectware instance. To learn more about writing Commissioning Files and Services, head over to the Learn Article called Service Basics.
Now let’s get straight to the point and start writing the Commissioning File.
This is the basic structure of a commissioning file:
---
description: Elastic Filebeat reading MQTT Input

metadata:
  name: Filebeat

parameters:

definitions:

resources:
Code-Sprache: YAML (yaml)Add a Cybus::Container Resource for the filebeat to the resources section in the template. This will later allow you to run the Container when installing and enabling the Service, using the docker image from docker.elastic.co directly:
resources:
  filebeat:
    type: Cybus::Container
    properties:
      image: docker.elastic.co/beats/filebeat:7.13.2
      volumes:
        - /var/run/docker.sock:/var/run/docker.sock:ro
Code-Sprache: YAML (yaml)When starting the filebeat container, various variables must be configured correctly. In this example, these variables should not be integrated into a specialized container image. Instead, the variables should be configured “on the fly” when starting the standard container image from within Connectware, so that the entire configuration is stored in a single commissioning file. For this purpose, all configuration settings of the filebeat container are specified in the helper section of the commissioning file, defining a variable called CONFIG inside of the file’s definitions section:
definitions:
  CONFIG: !sub |
    filebeat.config:
      modules:
        path: /usr/share/filebeat/modules.d/*.yml
        reload.enabled: false

    filebeat.inputs:
    - type: mqtt
      hosts:
        - tcp://${Cybus::MqttHost}:${Cybus::MqttPort}
      username: admin
      password: admin
      client_id: ${Cybus::ServiceId}-filebeat
      qos: 0
      topics:
        - some/topic

    setup.ilm.enabled: false
    setup.template.name: "some_template"
    setup.template.pattern: "my-pattern-*"

    output.elasticsearch:
      index: "idx-%{+yyyy.MM.dd}-00001"

    cloud.id: "elastic:d2V***"
    cloud.auth: "ingest:Xbc***"
Code-Sprache: YAML (yaml)Now that the Filebeat configuration is set up, the container resource filebeat mentioned above needs to be extended in order to use this configuration on startup (in this and the following examples, the top-level headline resources: is skipped for brevity):
filebeat:
  type: Cybus::Container
  properties:
    image: docker.elastic.co/beats/filebeat:7.13.2
    entrypoint: [""]
    command:
      - "/bin/bash"
      - "-c"
      - !sub 'echo "${CONFIG}" > /tmp/filebeat.docker.yml && /usr/bin/tini -s -- /usr/local/bin/docker-entrypoint -c /tmp/filebeat.docker.yml -environment container'
    volumes:
      - /var/run/docker.sock:/var/run/docker.sock:ro
Code-Sprache: YAML (yaml)The filebeat container needs access credentials to set up the cloud connection correctly. Those credentials should not be written into the file as hard-coded values though. Credentials as hard-coded values should be avoided not only for security reasons, but also to make the commissioning file re-usable and re-configurable for many more service operators. To easily achieve this, we are going to use parameters.
In the parameters section we are creating two parameters of type string:
parameters:
  filebeat-cloud-id:
    type: string
    description: The cloud id string, for example elastic:d2V***

  filebeat-cloud-auth:
    type: string
    description: The cloud auth string, for example ingest:Xbc***
Code-Sprache: YAML (yaml)
These parameters are now ready to be used in our configuration. During the installation of the service, Connectware will ask us to provide the required values for these parameters.
To use the parameters in the configuration, the following lines in the Filebeat configuration (the CONFIG definition from above) need to be adapted:
  cloud.id: "${filebeat-cloud-id}"
  cloud.auth: "${filebeat-cloud-auth}"
Code-Sprache: YAML (yaml)The filebeat container is using access credentials not only for the cloud connection but also for the local input connection, which is the connection to the Connectware MQTT broker. Those access credentials have been set to the default credentials (admin/admin) in the definition above, which now need to be adapted to the actual non-default credentials. For your convenience, Connectware already has Global Parameters that are replaced by the current credentials of the MQTT broker. So the following lines in the Filebeat configuration (the CONFIG definition from above) need to be adapted, too:
  username: ${Cybus::MqttUser}
  password: ${Cybus::MqttPassword}
Code-Sprache: YAML (yaml)Finally the defaultRole for this service requires additional read permissions for all MQTT topics which the service should consume. To grant these additional privileges, another resource should be added:
resources:
  defaultRole:
    type: Cybus::Role
    properties:
      permissions:
        - resource: some/topic
          operation: read
          context: mqtt
Code-Sprache: YAML (yaml)In the end, the entire service commissioning file should look like this:
---
description: Elastic Filebeat reading MQTT Input

metadata:
  name: Filebeat

parameters:
  filebeat-cloud-id:
    type: string
    description: The cloud id string, for example elastic:d2V***

  filebeat-cloud-auth:
    type: string
    description: The cloud auth string, for example ingest:Xbc***

definitions:
  # Filebeat configuration
  CONFIG: !sub |
    filebeat.config:
      modules:
        path: /usr/share/filebeat/modules.d/*.yml
        reload.enabled: false

    filebeat.inputs:
    - type: mqtt
      hosts:
        - tcp://${Cybus::MqttHost}:${Cybus::MqttPort}
      username: ${Cybus::MqttUser}
      password: ${Cybus::MqttPassword}
      client_id: ${Cybus::ServiceId}-filebeat
      qos: 0
      topics:
        - some/topic

    setup.ilm.enabled: false
    setup.template.name: "some_template"
    setup.template.pattern: "my-pattern-*"

    output.elasticsearch:
      index: "idx-%{+yyyy.MM.dd}-00001"

    cloud.id: "${filebeat-cloud-id}"
    cloud.auth: "${filebeat-cloud-auth}"

resources:
  # The filebeat docker container
  filebeat:
    type: Cybus::Container
    properties:
      image: docker.elastic.co/beats/filebeat:7.13.1
      entrypoint: [""]
      command:
        - "/bin/bash"
        - "-c"
        - !sub 'echo "${CONFIG}" > /tmp/filebeat.docker.yml && /usr/bin/tini -- /usr/local/bin/docker-entrypoint -c /tmp/filebeat.docker.yml -environment container'
      volumes:
        - /var/run/docker.sock:/var/run/docker.sock:ro

  # Gaining privileges
  defaultRole:
    type: Cybus::Role
    properties:
      permissions:
        - resource: some/topic
          operation: read
          context: mqtt
Code-Sprache: YAML (yaml)
This commissioning file can now be installed and enabled, which will also start the filebeat container and set up its connections correctly. However, there is probably no input data available yet, but we will get back to this later. Depending on the input data, an additional structure should be prepared for useful content in Elasticsearch, which is described in the next section.
The first contact with the Elasticsearch cluster can be verified by sending some message to the topic to which the Filebeat MQTT inputs are subscribed (here: “some/topic”) and reviewing the resulting event in Kibana.
Once this is done, a service integrator may identify several elements of the created JSON document that need to be changed. The deployed Connectware service commissioning file allows us to ship incoming MQTT messages in configured topics to the Elasticsearch cluster as a JSON document with certain meta data that an operator may want to change to improve the data source information.
For example, a message sent using the service described above contains multiple fields with identical values, in this case agent.name, agent.hostname and host.name. This is due to the naming convention for container resources in a service commissioning files described in the Connectware Container Resource. As the ServiceId is “filebeat”, and the container resource is named “filebeat” too, the resulting container name, hostname and agent name in the transmitted search index documents are “filebeat-filebeat”, which looks as follows:
...
"fields": {
...
   "agent.name": [
     "filebeat-filebeat"
   ],
   "host.name": [
     "filebeat-filebeat"
   ],
...
   "agent.hostname": [
     "filebeat-filebeat"
   ],
...
Code-Sprache: YAML (yaml)
To get appropriate names in the search index for further evaluation and post processing, either change the serviceId and/or container resource name in the service commissioning file, or use Filebeat configuration options to set an alternative agent.name (by default is derived from the hostname, which is the container hostname created by Connectware). Be aware that the maximum number of characters for the clientId in Filebeat mqtt.input configuration is 23.
Change both the service name (serviceId) and the container resource name to identify the respective device as the data source, and redeploy the service commissioning file:
...
metadata:
  name: Shopfloor 1

...
resources:
  # The filebeat docker container
  filebeat_Machine_A_032:
...
Code-Sprache: YAML (yaml)
In addition to this, the Filebeat configuration can be modified slightly to set the agent.name appropriately along with some additional tags to identify our edge data sources and data shipper instance (is useful to group transactions sent by this single Beat):
...
definitions:
  CONFIG: !sub
...
   name: "shopfloor-1-mqttbeat"
   tags: [ "Cybus Connectware", "edge platform", "mqtt" ]
...
Code-Sprache: YAML (yaml)
This leads to improved field values in the search index, so that transactions can be better grouped in the search index, such as this:
...
"fields": {
...
   "agent.name": [
     "shopfloor-1-mqttbeat"
   ],
   "host.name": [
     "shopfloor-1-mqttbeat"
   ],
...
   "agent.hostname": [
     "shopfloor1-filebeat_Machine_A_032"
   ],
...
   "tags": [
     "Cybus Connectware",
     "edge platform",
     "mqtt"
   ],
...

Code-Sprache: YAML (yaml)Using Cybus Connectware offers extensive flexibility in mapping devices, configuring pre-processing rules and adding many different resources. It is up to the customer to define the requirements, so that a well-architected set of services can be derived for the Connectware instance.
To stream machine data collected by Connectware to Elasticsearch, existing MQTT topics can be subscribed by the Filebeat container. Alternatively, the Filebeat container can subscribe to MQTT topics that contain specific payload transformation. For instance, a normalized payload for an Elasticsearch index specifies an additional timestamp or specific data formats.
The advantage of using Connectware to transmit data to Elasticsearch is that it supports a lightweight rules engine to map data from different machines to Filebeat by just working with MQTT topics, for example:
resources:
  # mapping with enricher pattern for an additional timestamp
  machineDataMapping:
    type: Cybus::Mapping
    properties:
      mappings:
       - subscribe:
            topic: !sub '${Cybus::MqttRoot}/machineData/+field'
          rules:
            - transform:
                expression: |
                  (
                    $d := { $context.vars.field: value };
                    $merge(
                      [
                        $last(),
                        {
                          "coolantLevel": $d.`coolantLevel`,
                          "power-level": $d.`power-level`,
                          "spindleSpeed": $d.`spindleSpeed`,
                          "timestamp": timestamp
                        }
                      ]
                    )
                  )
          publish:
            topic: 'some/topic'

Code-Sprache: YAML (yaml)
A reasonable structural design of related Connectware service commissioning files depends on the number of machines to connect, their payload, complexity of transformation and the search index specifications in the Elasticsearch environment. See the Github project for a more advanced example concerning machine data transformation.
To explain these settings in detail, Cybus provides a complete Connectware documentation and Learn articles like Service Basics.
What has been added to the original Filebeat configuration is the typical task of a service operator connecting shopfloor devices and organizing respective resources in a Connectware service commissioning file. The service operator has further options to decompose this file to multiple files to optimize the deployment structure in this Low-code/No-code environment for their needs. Contact Cybus to learn more about good practices here.
Now that the data is transmitted to the Elasticsearch cluster, further processing is up to the search index users. The Elastic Stack ecosystem provides tools for working with search indices created from our data, such as simple full text search with Discovery, Kibana visualizations or anomaly detection and so on.
The message is transmitted as a message string and will be stored as a JSON document with automatically de-composed payload and associated metadata for the search index. A simple discovery of that continuously collected data shows something like this:
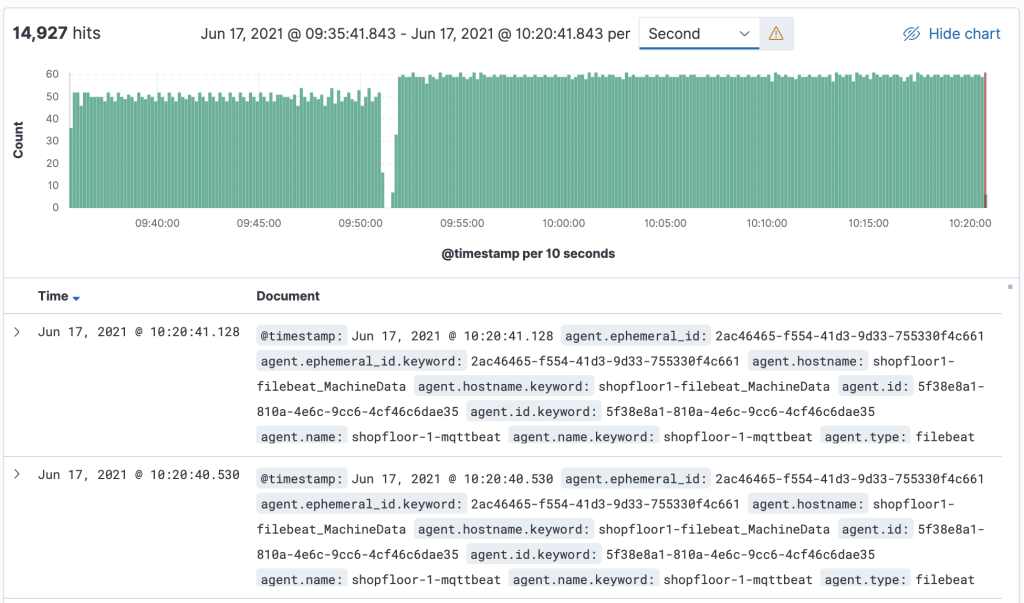
This lesson offered a brief introduction into the integration of Cybus Connectware with Elasticsearch using the Connectware built-in MQTT connector and the FileBeat with MQTT Input in a service commissioning file.
Additionally, Cybus provides sample service commissioning files and some other technical details in the Github project How to integrate Elasticsearch with Connectware.
As a next step, you can use Cybus Connectware to organize data ingestion from multiple machines for its further use with the Elastic Stack.
In this lesson you will learn how to install Cybus Connectware directly onto a Linux system. The following topics are covered by this article:
This lesson assumes that you already have an account for the Cybus Portal. If you have no valid credentials, please contact our sales team.
If you want to refresh your knowledge of Docker before starting this lesson see Docker Basics Lesson.
Docker and Docker Compose must also be installed and running on your host. During the installation an internet connection is required to download Docker images fromregistry.cybus.io.
If Docker is not installed, start here:
If Docker Compose is not installed, then see here https://docs.docker.com/compose/install/
During the installation you will be asked to enter your Connectware license key. Follow these steps to obtain your license key.


Installing Connectware is made easy using the prebuilt installer script provided by Cybus. To download and use the script follow the steps below.
download.cybus.io/<VERSION>/connectware-online-installer.sh. In the example below we will use the latest version of Connectware.$ wget -O ./connectware-online-installer.sh https://download.cybus.io/latest/connectware-online-installer.sh
Code-Sprache: YAML (yaml)$ cat connectware-online-installer.sh
Code-Sprache: YAML (yaml)$ chmod +x ./connectware-online-installer.sh
Code-Sprache: YAML (yaml)The installer script is now ready to be run.
$ sudo ./connectware-online-installer.sh
Code-Sprache: YAML (yaml)/opt/connectwareIf all requirements are met then you should see the following output.
Running preflight checks.
=========================
Validating write permission to installation location /opt/connectware: [OK]
Checking whether this system has systemd: [YES]
Validating required utility installation: [OK]
Validating Cybus docker-registry connection: [OK]
Validating Docker installation: [OK]
Validating Docker Compose installation: [OK]
Validating that no former Connectware is running: [OK]
Preflight checks finished successfully!
Code-Sprache: YAML (yaml)Verifying license key...
Login succeeded.
Code-Sprache: YAML (yaml)Please review and confirm the following Connectware configuration:
------------------------------------------------------------------
Connectware license key: [VALID]
Installation directory: /opt/connectware
Autostart as systemd service: true
Accept configuration? [Y/n]
Code-Sprache: YAML (yaml)-----------------------------------------
Removing old Docker images
-----------------------------------------
The following Docker images are from previous Connectware versions and can be removed:
REPOSITORY TAG IMAGE ID CREATED SIZE
registry.cybus.io/cybus/admin-web-app *********** e561383a5 24 hours ago 21.5MB
REPOSITORY TAG IMAGE ID CREATED SIZE
registry.cybus.io/cybus/auth-server *********** a65b7f32f 24 hours ago 165MB
REPOSITORY TAG IMAGE ID CREATED SIZE
registry.cybus.io/cybus/broker *********** 80dd0fb24 24 hours ago 56.7MB
(...)
-----------------------------------------
Should the above docker images be removed from your local computer (pruned)? [Y/n]
Code-Sprache: YAML (yaml)Successfully installed Connectware!
===================================
You can find the installation directory at /opt/connectware.
In order to stop type:
systemctl stop connectware
Code-Sprache: YAML (yaml)Running the installer with the -s or --silent flag will start the installation in an automated mode without the need of user interaction.
To use this way of deploying Connectware the license key has to be supplied using the --license-key flag.
This deploys Connectware in a minimal configuration to the default /opt/connectware directory without installing the systemd service.
You can further personalize your installation using the supported installation flags. To see a full list of options just run the installation script with the --help flag.
To perform an update of an existing Connectware installation is just as easy as installing a new one.
All you need to do is to obtain the new installer script by following the same steps as described in the chapters Prepare Installer Script.
To upgrade an existing installation just choose the same folder your Connectware is currently running in.
All your custom settings like license key or network settings will automatically be migrated.
If you are asked for your license key during the update, you might have specified a wrong installation directory. If this is the case, please cancel the update and ensure you choose the correct installation path.
Remember that if your existing Connectware used elevated privileges during installation to also run the update using sudo.
The easiest way to update to a newer version is to run the update in silent mode. All you have to do is to start the installer script using the silent -s and directory -d flags.
$ ./connectware-online-installer.sh -s -d <PATH/TO/YOUR/CONNECTWARE/FOLDER>
Code-Sprache: YAML (yaml)In case you need to update or change the certificate files (for example if you renewed them using certbot with Let’s Encrypt or want to add a self-signed certificate) you can do this by copying them to Connectware:
$ docker cp -L <path-to/your-key-file.key> <your-connectware-container>:/connectware_certs/cybus_server.key
$ docker cp -L <path-to/your-cert-file.crt> <your-connectware-container>:/connectware_certs/cybus_server.crtCode-Sprache: YAML (yaml)
The name of your Connectware container depends on the directory it was installed to and is rendered as <your-connectware-directory>_connectware_1. By default Connectware is installed to /opt/connectware/ which results in the container name connectware_connectware_1.
Restart the Connectware proxy to apply the changed files.
$ docker restart <your-connectware-container>
Code-Sprache: YAML (yaml)
Removing Connectware from your system is a manual process. Follow the steps below in your terminal to remove Connectware.
systemctl stop connectware. Otherwise change into your installation directory and manually stop the running instance with docker-compose down.$ systemctl stop connectware
$ systemctl disable connectware
$ rm /etc/systemd/system/connectware.service
Code-Sprache: YAML (yaml)$ rm -rf /opt/connectware
Code-Sprache: YAML (yaml)List all images, containers, volumes and networks:
$ docker images -a
$ docker container ls -a
$ docker volume ls
$ docker network ls
Code-Sprache: YAML (yaml)
To remove a specific container:
$ docker container rm <CONTAINER-NAME>
Code-Sprache: YAML (yaml)
Remove a specific image:
$ docker image rm <IMAGE-NAME>
Code-Sprache: YAML (yaml)
For removing a specific volume:
$ docker volume rm <VOLUME-NAME>Remove a specific network:
$ docker network rm <NETWORK-NAME>
Code-Sprache: YAML (yaml)
If you have no docker applications other then Connectware running on your system you can also simply remove all artifacts by running
$ docker system prune -a -f
Code-Sprache: YAML (yaml)
Please keep in mind that this will remove all currently unused docker resources not only those created by Connectware.
After following all the steps above, Connectware is now installed. You can access the Admin UI by opening your browser and entering the host’s IP address directly: https://<HOST-IP>.
The initial login credentials are
Username: admin
Password: admin
If you would like to learn more how to use Connectware, check out our docs at https://docs.cybus.io/ or see more guides here.
With the combined solution of Cybus Connectware and the Waylay Automation Platform, business users and IT professionals can build their own smart industrial use cases.
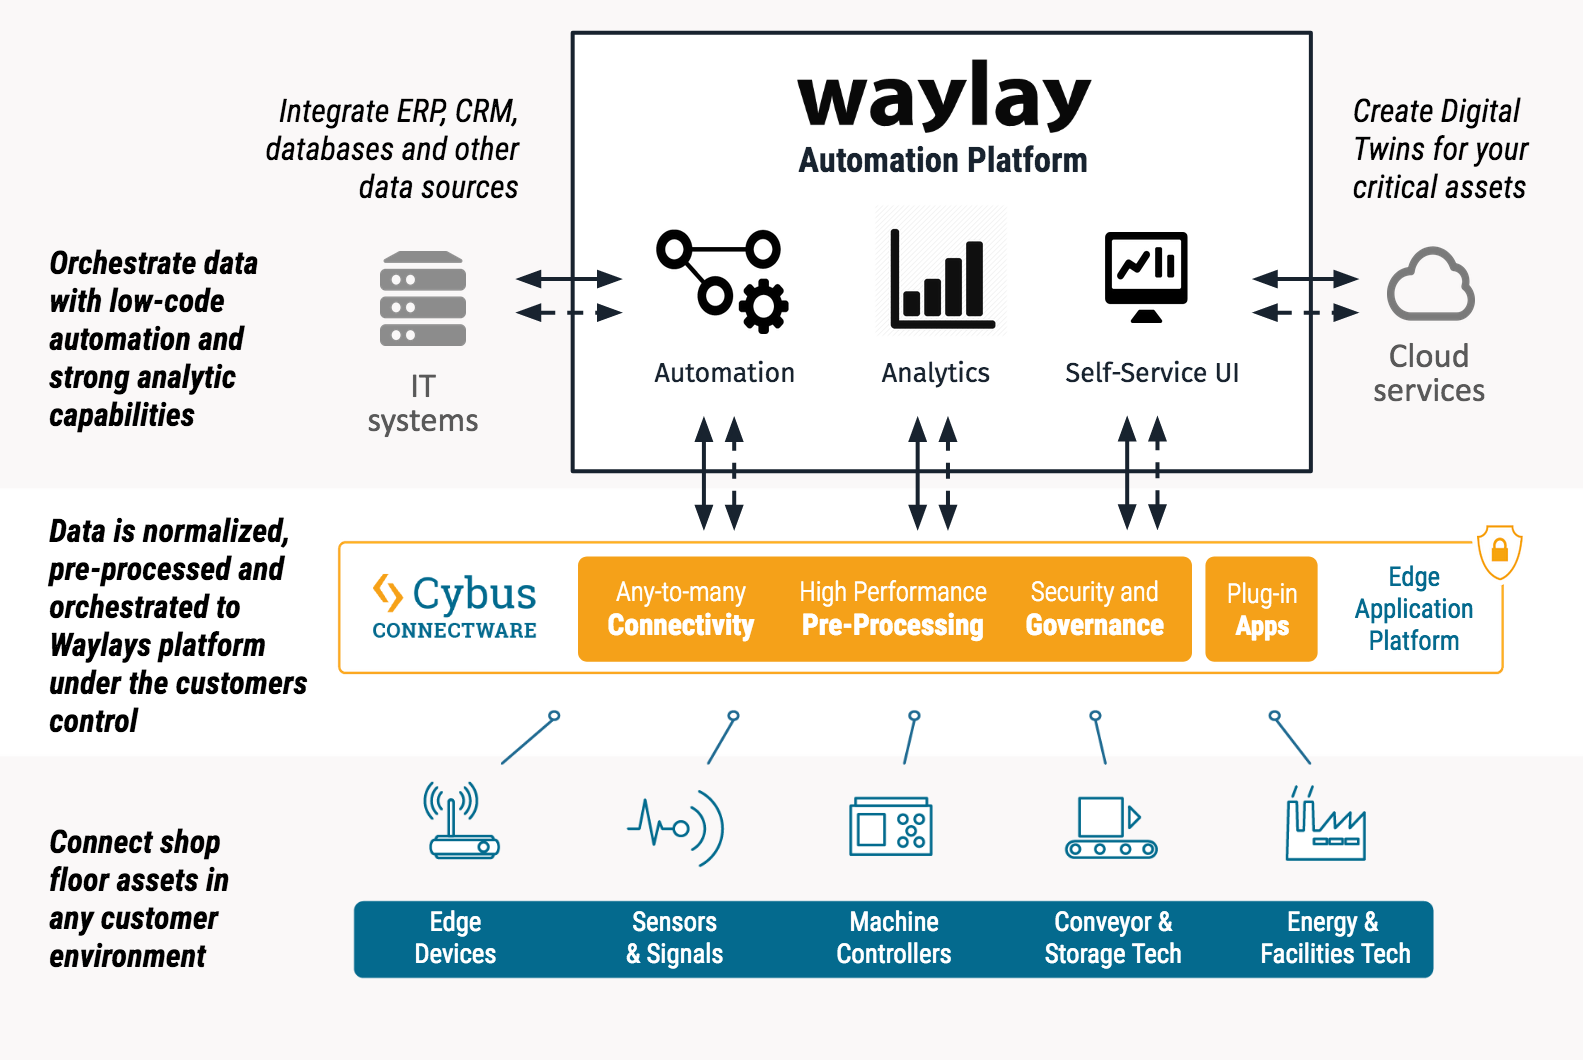
The following video demonstrates, how three use cases can be realized with both, the Cybus Connectware and the Waylay Auomation Platform in combination.
The demonstration video delivers not only insights into both platforms and their user interface, but also delivers a step-by-step guide for three use cases. It is shown how to create:
1. Transparency in customer’s shop floor
2. Prediction of critical coolant level
3. Realization of a service level agreement based on machine data
For these use cases, the Cybus Connectware enables a connection of two milling machines from different generations (Modbus TCP and OPC UA) to extract real-time data. Temperature as well as coolant liquid level will be scanned. With the Connectware, the data is normalized and a common information model is created.
To provide the data to Waylay’s Automation Platform, it is made available in MQTT.
The Waylay Automation Platform then visualizes the machine data by offering a user-friendly dashboard. The demo video also shows how to create a business logic and the workflow needed for the three use cases with the Waylay Automation Platform.
We know how unique the use cases and technical infrastructure of each company are. We therefore invite you for a live demo that picks up your current situation or your future goals. Get your live demo to find out what Cybus Connectware adds to your company:
This lesson assumes that you want to set up an OPC Unified Architecture (a.k.a OPC UA) server as an integrated Connectware resource which other clients can connect to. To understand the basic concepts of the Connectware, please take a look at the Technical Overview lesson.
To follow along with the example, you will need a running instance of the Connectware 1.0.18 or later. In case you do not have that, learn How to install the Connectware.
In this article we will create a Connectware service which configures and enables the OPC UA server. If you are new to services and creating commissioning files, read our article about Service Basics. If you would like to set up the Connectware as an OPC UA client, please view the article How to Connect to an OPC UA Server.
This article will teach you how to use the Connectware OPC UA server resource in your system setup. In more detail, the following topics are covered:
You can download the service commissioning file that we use in this example from the Cybus GitHub repository.
We will use Prosys OPC UA Client for testing in this guide. However, it is up to you to decide which tool to work with. You can use FreeOpcUa’s Simple OPC UA GUI client, which is open source and available for all major OS’s. If you feel more comfortable working on the terminal, go for Etienne Rossignon’s opcua-commander. In case you prefer online tools, try One-Way Automation’s OPC UA Web Client. It is free to use, but you will be asked to sign up first and you will not be able to connect to servers on your local network.
Since the release of version 1.0.18, Connectware supports a new type of resource that can be utilized in services: The server resource enables services to run servers within Connectware and the first protocol supported by this resource is OPC UA. Thus, you can set up an OPC UA server, which can be used to receive data from or provide data to devices or applications mainly in industrial environments. Being fully integrated into Connectware, this feature allows to reduce the overheads in selecting, deploying, maintaining and integrating a separate software for fulfilling this demand in your system.
The OPC UA server is internally connected to the Connectwares protocol mapper, which means that you can map your data from any other protocol supported by the Connectware directly on data nodes of the OPC UA server. In the service commissioning file, OPC UA server nodes can be handled just as any other endpoint. Therefore, you can use them in mappings as usual by simply defining the data source and target.
The Commissioning File contains all resource definitions and is read by Connectware. To understand the file’s anatomy in detail, please consult our Reference docs.
Start by opening a text editor and creating a new file, e.g. opcua-server-example-commissioning-file.yml. The commissioning file is in the YAML format, perfectly readable for both humans and machines! We will now go through the process of defining the required sections for this example.
These sections contain more general information about the commissioning file. You can give a short description and add a stack of metadata. As for metadata, only the name is required, while the rest is optional. We will use the following set of information for this lesson:
description: >

 OPC UA Server Example Commissioning File
 Cybus Learn - How to set up the integrated Connectware OPC UA server
 https://www.cybus.io/learn/how-to-set-up-the-integrated-connectware-opc-ua-server/

metadata:

 name: OPC UA Server Example Commissioning File
 version: 1.0.0
 icon: https://www.cybus.io/wp-content/uploads/2019/03/Cybus-logo-Claim-lang.svg
 provider: cybus
 homepage: https://www.cybus.io
Code-Sprache: YAML (yaml)In the resources section we declare every resource that is needed for our application. The first necessary resource is the OPC UA server.
resources:
 opcuaServer:
   type: Cybus::Server::Opcua
   properties:
     port: 4841
     resourcePath: /UA/CybusOpcuaServer
     alternateHostname: localhost
     applicationUri: 'urn:cybus:opcua:server:1'
     allowAnonymous: true
     securityPolicies: ["None", "Basic256Sha256"]
     securityModes: ["None", "SignAndEncrypt"]
Code-Sprache: YAML (yaml)
We create the OPC UA server by defining the type of the resource, namely Cybus::Server::Opcua. Then we define its properties: we set the port to 4841 to not get in conflict with other possibly present OPC UA servers. You can also set values for resourcePath and applicationUri, however in this case we proceed with the default ones. We have to set the alternateHostname to the own IP address of the Connectware host and we set allowAnonymous to true, so we can access the server without creating a user for this example. Note that this is not recommended for productive environments. With securityPolicies and securityModes we can define the options that should be supported by the server as an array.
The next resources needed are the OPC UA server nodes. Let’s extend our list with some resources of the type Cybus::Node::Opcua.
1_root:
   type: Cybus::Node::Opcua
   properties:
     nodeType: Object
     parent: !ref opcuaServer
     nodeId: ns=1;s=1_root
     browseName: "root"

 1.1_DataNodes:
   type: Cybus::Node::Opcua
   properties:
     nodeType: Object
     parent: !ref 1_root
     nodeId: ns=1;s=1.1_DataNodes
     browseName: "DataNodes"
Code-Sprache: YAML (yaml)
The node resources of the OPC UA server build up a hierarchy of objects and variables. We create two levels of parent nodes here, which are of the nodeType Object. The first level is the root node. This has the server itself as a parent and we reference the server resource by using !ref opcuaServer. The second level then has the root as a parent, also defined by referencing. In this way, you can build up a hierarchy in which you can then create your variable nodes.
1.1.1_Boolean:
   type: Cybus::Node::Opcua
   properties:
     nodeType: Variable
     parent: !ref 1.1_DataNodes
     operation: serverProvides
     nodeId: ns=1;s=1.1.1_Boolean
     browseName: Boolean
     dataType: Boolean
     initialValue: false

 1.1.2_Int32:
   type: Cybus::Node::Opcua
   properties:
     nodeType: Variable
     parent: !ref 1.1_DataNodes
     operation: serverReceives
     nodeId: ns=1;s=1.1.2_Int32
     browseName: Int32
     dataType: Int32
     initialValue: 0

 1.1.3_String:
   type: Cybus::Node::Opcua
   properties:
     nodeType: Variable
     parent: !ref 1.1_DataNodes
     operation: serverProvidesAndReceives
     nodeId: ns=1;s=1.1.3_String
     browseName: String
     dataType: String
     initialValue: "intial"
Code-Sprache: YAML (yaml)
The variable nodes are of the type Cybus::Node::Opcua as well, but their nodeType is Variable. As a parent for our variables, we choose !ref 1.1_dataNodes. The operation which these nodes should serve can be of three types: serverProvides, serverReceives and serverProvidesAndReceives. serverProvides is a node which provides data and can be read by the OPC UA client. serverReceives is a node that receives data from an OPC UA client, while serverProvidesAndReceives nodes can be used in both ways. Furthermore, we choose a dataType for every variable and an initialValue which is the value present on the node after the server has started.
For all nodes in this section we defined a nodeId and a browseName, which can be used to address the nodes. The node ID must be unique on the server. The browse name can be used multiple times, but any browse path derived from it must be unique. However, explaining the OPC UA address space is certainly out of scope for this lesson. If you would like to learn more about the concepts of the OPC UA address space, then the Address Space Concepts documentation by Unified Automation will be a good place to start.
At this point we would already be able to read and write values to the OPC UA server utilizing OPC UA clients. However, to transfer data from devices or applications using other protocols to the OPC UA server, we have to create a mapping. This will allow us to forward data from any other protocol to be provided through the OPC UA server, or conversely, forward data received through the OPC UA server to any other protocol.
MqttMapping:
   type: Cybus::Mapping
   properties:
     mappings:
       - subscribe:
           topic: "opcua/provides/boolean"
         publish:
           endpoint: !ref 1.1.1_Boolean
       - subscribe:
           endpoint: !ref 1.1.2_Int32
         publish:
           topic: "opcua/receives/int32"
       - subscribe:
           endpoint: !ref 1.1.3_String
         publish:
           topic: "opcua/receives/string"
       - subscribe:
           topic: "opcua/provides/string"
         publish:
           endpoint: !ref 1.1.3_String
Code-Sprache: YAML (yaml)
In this case we want to provide the boolean values published on the MQTT topic opcua/provides/boolean, which will be provided on the OPC UA server node 1.1.1_Boolean. We will achieve this by referencing the node using !ref. Furthermore, we want the values received by the OPC UA node 1.1.2_Int32 to be published on MQTT topic opcua/receives/int32. To be able to use 1.1.3_String in both directions, we need to create two mappings: one to publish received values on opcua/receives/string and one to provide values published on opcua/provides/string to the OPC UA clients.
Instead of publishing or subscribing to MQTT topics, we could also reference endpoints on connections of other protocols in the same way as we do it for the OPC UA server nodes.
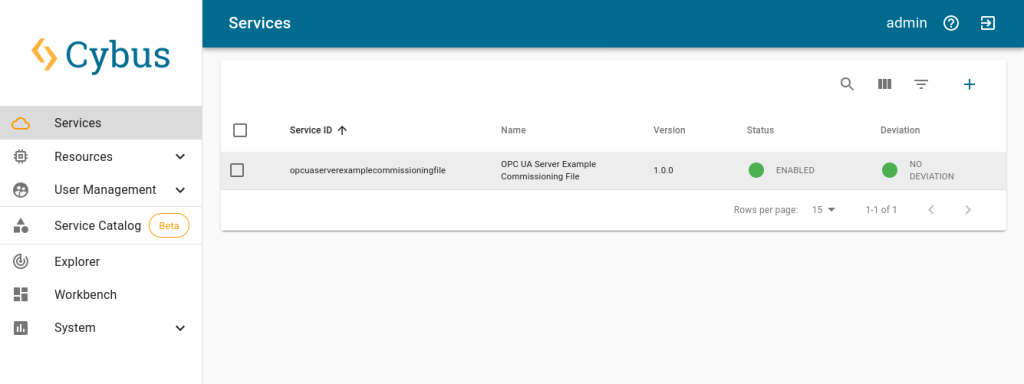
You now have the commissioning file ready for installation. Go to the Services tab in the Connectware Admin UI and click the (+) button to select and upload the commissioning file. After confirming this dialog, the service will be installed. On enabling the service, all the resources we just defined will be created: The OPC UA server, the server nodes and the mapping. Once the service has been successfully enabled, you can go ahead and see if everything works.
Now that our OPC UA server is running, we can go to the Explorer tab, where the tree structure of our newly created endpoints can be seen and the endpoints can be inspected. Hover over an entry and select the eye icon on the right – this activates the live view.
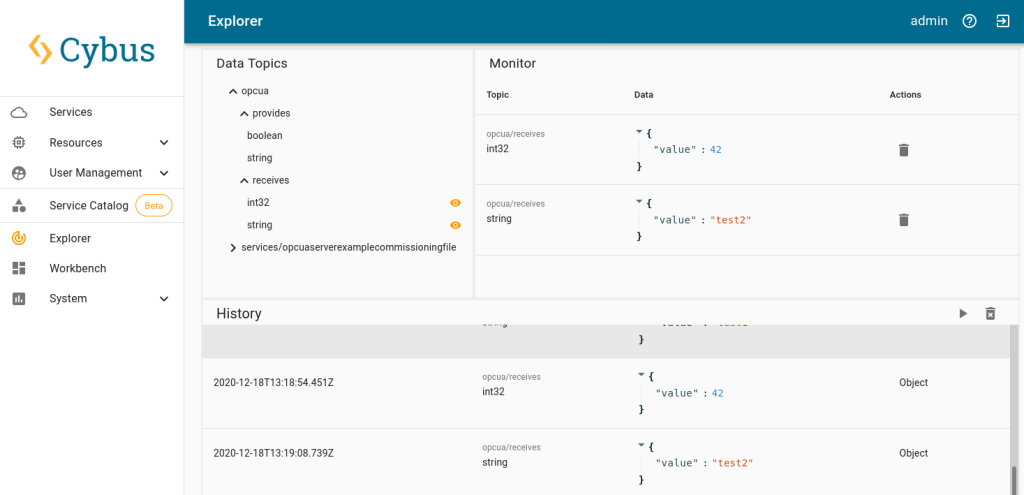
We can now use the OPC UA client to connect to our server on port 4841. Since we configured it to accept anonymous clients, we can just go ahead. If we wanted to allow access only to registered users, we would create them in the Connectware user management. But for now, after connecting to our OPC UA server anonymously, we can send data to the receiving variable nodes. In the Explorer view we can then see this data being published on the MQTT topics, on which we mapped the OPC UA variable nodes.
Additionally utilizing an MQTT client, we could now subscribe to this data or also publish data on the topic which is mapped on the providing variable nodes to send it to OPC UA clients. An easy way to experiment with these possibilities is the Workbench. There you can also easily configure MQTT nodes for quick prototyping. See our other articles to learn more about the Workbench.
Setting up an OPC UA server with a service commissioning file is quite simple. To adjust the server to suit your needs, the configuration with the commissioning file offers various additional options which are described in the Connectware Docs. Being integrated into Connectware, this OPC UA server can also be directly connected to the protocol mapper and through it to systems using other protocols.
Connectware offers powerful features to build and deploy applications for gathering, filtering, forwarding, monitoring, displaying, buffering, and all kinds of processing data… why not build a dashboard, for instance? For guidance, read more on Cybus Learn.
This article describes how to integrate your Azure IoT Hub with Connectware. It will help you configure the necessary Connectware service commissioning file and provide examples of mapping data from Connectware to Azure IoT Hub and vice versa. In addition, the article links to helpful tools to help you work with Azure IoT Hub and implement your use cases faster.
As described in the official Azure documentation, Azure IoT Hub supports communication via MQTT. There are two ways to communicate with the IoT Hub device endpoints:
In this article, we will focus on connecting via TCP port 8883, which is the standard secure communication port for MQTT and is the preferred integration of Azure IoT Hub with Connectware.
To access Azure IoT Hub, we need some connection properties that we add as definitions (i.e. constant values) to our commissioning file.
For now, do not worry about copying the commissioning file snippets together into one, we provide you with a link to the complete example file at the end.
definitions:

  iotHubHostname: <full CName of your Azure IoT Hub>
  mqttPort: 8883
  deviceId: <Your deviceID>
  sasToken: <Your generated SAS Token>
Code-Sprache: YAML (yaml)To connect to Azure IoT Hub, we set up a Cybus::Connection resource in the resources section. The connection uses the general MQTT connector from Connectware. For an overview of the connection properties, refer to MQTT (Cybus documentation).
With the !ref tag we reference the definitions from our previous step. The username is a string composed of the iotHubHostname and the deviceId, to concatenate strings we need the !sub tag. With this tag in place, we can include the definitions within the string by enclosing them in curly brackets and a preceding $.
resources:
  mqttConnection:
    type: Cybus::Connection
    properties:
      protocol: Mqtt
      connection:
        host: !ref iotHubHostname
        port: !ref mqttPort
        username: !sub "${iotHubHostname}/${deviceId}/?api-version=2021-04-12"
        password: !ref sasToken
        clientId: !ref deviceId
        scheme: tls
        keepalive: 3600
Code-Sprache: YAML (yaml)
This is all we need to establish the initial connection to Azure IoT Hub. Now let’s define our read endpoint.
If the Connectware host system does not have access to root CAs, you may need to add the Azure root certificate to your configuration using the caCert property. For more information on Azure root certificates, refer to the Azure documentation.
You can connect to a specific endpoint on Azure IoT Hub. To write data from Connectware to Azure IoT Hub, the topic is defined by Azure IoT Hub. For more information on this, refer to the Azure documentation.
  # Device to Cloud
  d2cEndpoint:
    type: Cybus::Endpoint
    properties:
      protocol: Mqtt
      connection: !ref mqttConnection
      topic: d2cEndpoint
      qos: 0
      write:
        topic: !sub "devices/${deviceId}/messages/events/"
Code-Sprache: YAML (yaml)To read data from Azure IoT Hub, we need another endpoint. In this case, we subscribe to a wildcard topic to receive all data for the device ID we are connected to. Note that this topic is already defined by Azure IoT Hub.
  # Cloud to Device
  c2dEndpoint:
    type: Cybus::Endpoint
    properties:
      protocol: Mqtt
      connection: !ref mqttConnection
      topic: c2dEndpoint
      subscribe:
        topic: !sub "devices/${deviceId}/messages/devicebound/#"
Code-Sprache: YAML (yaml)Here are two example mappings that route topics from Connectware to the endpoints we configured before. Replace the topic Azure/IoTHub/Write with the topic where you want to publish the data to be sent to Azure IoT Hub. In the second mapping, replace Azure/IoTHub/Read with the topic where you want to access the data that comes from Azure IoT Hub.
  deviceToCloudMapping:
    type: Cybus::Mapping
    properties:
      mappings:
        - subscribe:
            topic: Azure/IoTHub/Write
          publish:
            endpoint: !ref d2cEndpoint

  cloudToDeviceMapping:
    type: Cybus::Mapping
    properties:
      mappings:
        - subscribe:
            endpoint: !ref c2dEndpoint
          publish:
            topic: Azure/IoTHub/Read
Code-Sprache: YAML (yaml)There are some helpful tools that are suitable for prototyping or exploring the data on your Azure IoT Hub within Visual Studio Code. These tools should help you to implement your use cases faster.
The Workbench service that comes with Connectware is a Node-RED instance that runs securely inside Connectware as a service. This allows you to install any Node-RED nodes within the service container for quick prototyping.
Important: We do not recommend using Node-RED in production instances as we cannot guarantee reliability. This should only be considered as a rapid-prototyping tool.
node-red-contrib-azure-iot-hub is a Node-RED module that allows you to send messages and register devices with Azure IoT Hub. It includes a total of four Node-RED cloud nodes: Azure IoT Hub, Azure IoT Registry, Azure IoT Hub Receiver, and Azure IoT Hub Device Twin. For more information on the module, refer to Node-Red.
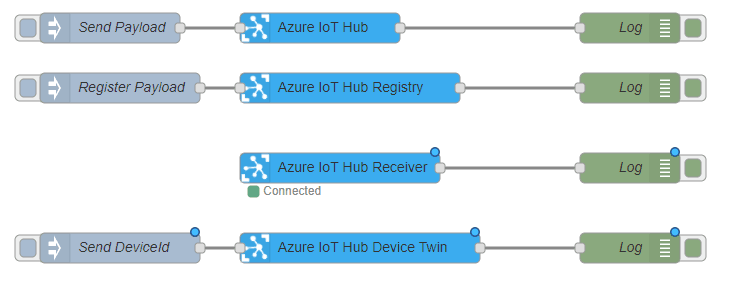
Azure IoT Tools is a collection of Visual Studio Code extensions for working with Azure IoT Hub. With these extensions, you can interact with an Azure IoT Hub instance, manage connected devices, and enable distributed tracing for your IoT Hub applications. You can also subscribe to telemetry messages sent to the IoT Hub for quick testing.
For more information on installing and using Azure IoT tools, refer to the Visual Studio Marketplace.
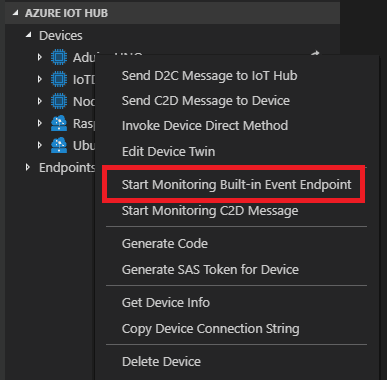
Azure IoT Explorer is an open source cross-platform user interface for interacting with Azure IoT Hub without logging into the Azure portal. This tool can be used to perform tasks like creating, deleting, and querying devices within the IoT Hub. Device functions such as sending and receiving telemetry, and editing device and module twin configuration are also possible with this tool.
For more information on Azure IoT Explorer, refer to GitHub.
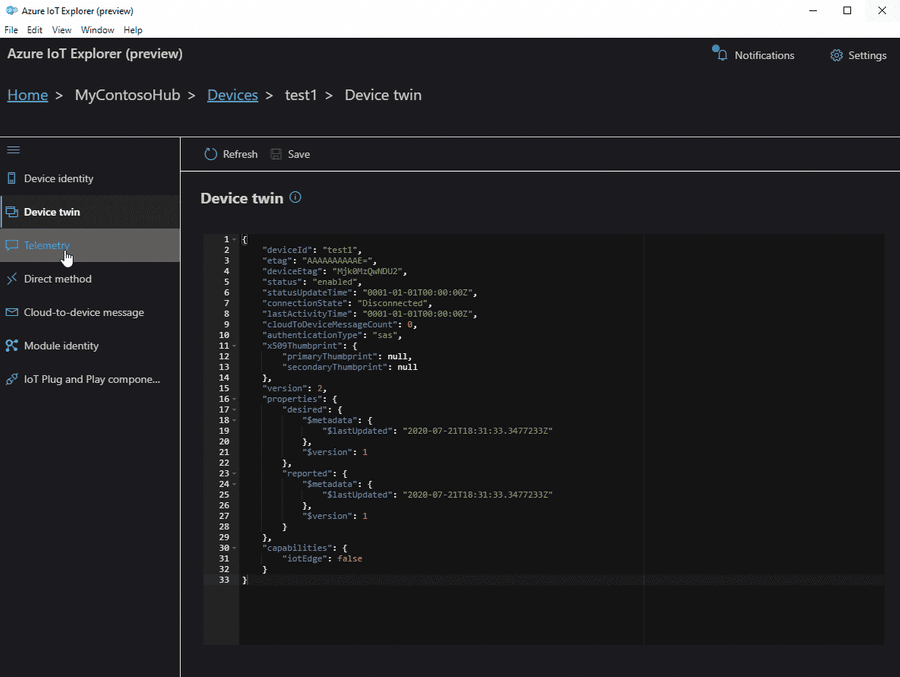
In this lesson, we will send data from the Connectware MQTT Broker to AWS IoT.
It is required to set up a Connectware instance and at least one AWS IoT Device. In case of using AWS IoT at the edge, an AWS IoT Greengrass Core has to be set up.
We assume you are already familiar with Connectware and its service concept. If not, we recommend reading the articles Connectware Technical Overview and Service Basics for a quick introduction. Furthermore, this lesson requires basic understanding of MQTT and how to publish data on an MQTT topic. If you want to refresh your MQTT knowledge, we recommend the lessons MQTT Basics and How to connect an MQTT client to publish and subscribe data.
This article is divided into three parts.
First, it provides general information about AWS IoT services and their differences. Feel free to skip this section if you are familiar with AWS IoT and the differences between AWS IoT Core and IoT Greengrass.
Then, the current integration mechanisms between Connectware and the AWS IoT are explained through a hands-on approach.
Finally, the article describes the tools to work with your MQTT use case to prototype, review and monitor the integration scenario.
AWS IoT is a managed cloud platform that lets connected devices interact easily and securely with cloud applications and other devices. AWS IoT practically supports a nearly unlimited number of devices and messages, and can process and route those messages to AWS endpoints and to other devices reliably and securely.
For AWS IoT, Amazon offers a software development kit available for most popular programming languages and platforms.
AWS IoT Core is the main component to manage devices, their certificates, shadows, Greengrass resources and integration rules to subsequent AWS resources like IoT Analytics. It also offers ways to audit and test your IoT use cases.
AWS IoT Greengrass extends AWS Cloud resources to edge devices, so they can act locally on the generated data, while still using the cloud for management, analytics, and durable storage. It is possible for connected devices to interact with AWS Lambda functions and Docker containers, execute predictions based on machine learning models, keep device data in sync, and communicate with other devices – even when not connected to the Internet.
Greengrass has the following advantages:
Although in many scenarios these advantages are very significant, one could also mention some drawbacks to make the picture more complete:
Before proceeding further, first set up AWS IoT Core (and AWS IoT Greengrass for an edge deployment) by following the respective instructions:
To integrate AWS IoT with Cybus Connectware, the built-in MQTT connector with TLS support is the simplest, most reliable and secure way of communication. For a successful AWS IoT integration, Connectware does not require more than that. As an additional advantage, the Connectware MQTT connector has also data buffering built-in, so that data is stored locally when there is a temporary connection failure with AWS IoT Core or Greengrass Core.
There can be two integration scenarios.
In the first integration scenario, the Connectware connects directly to the AWS cloud:
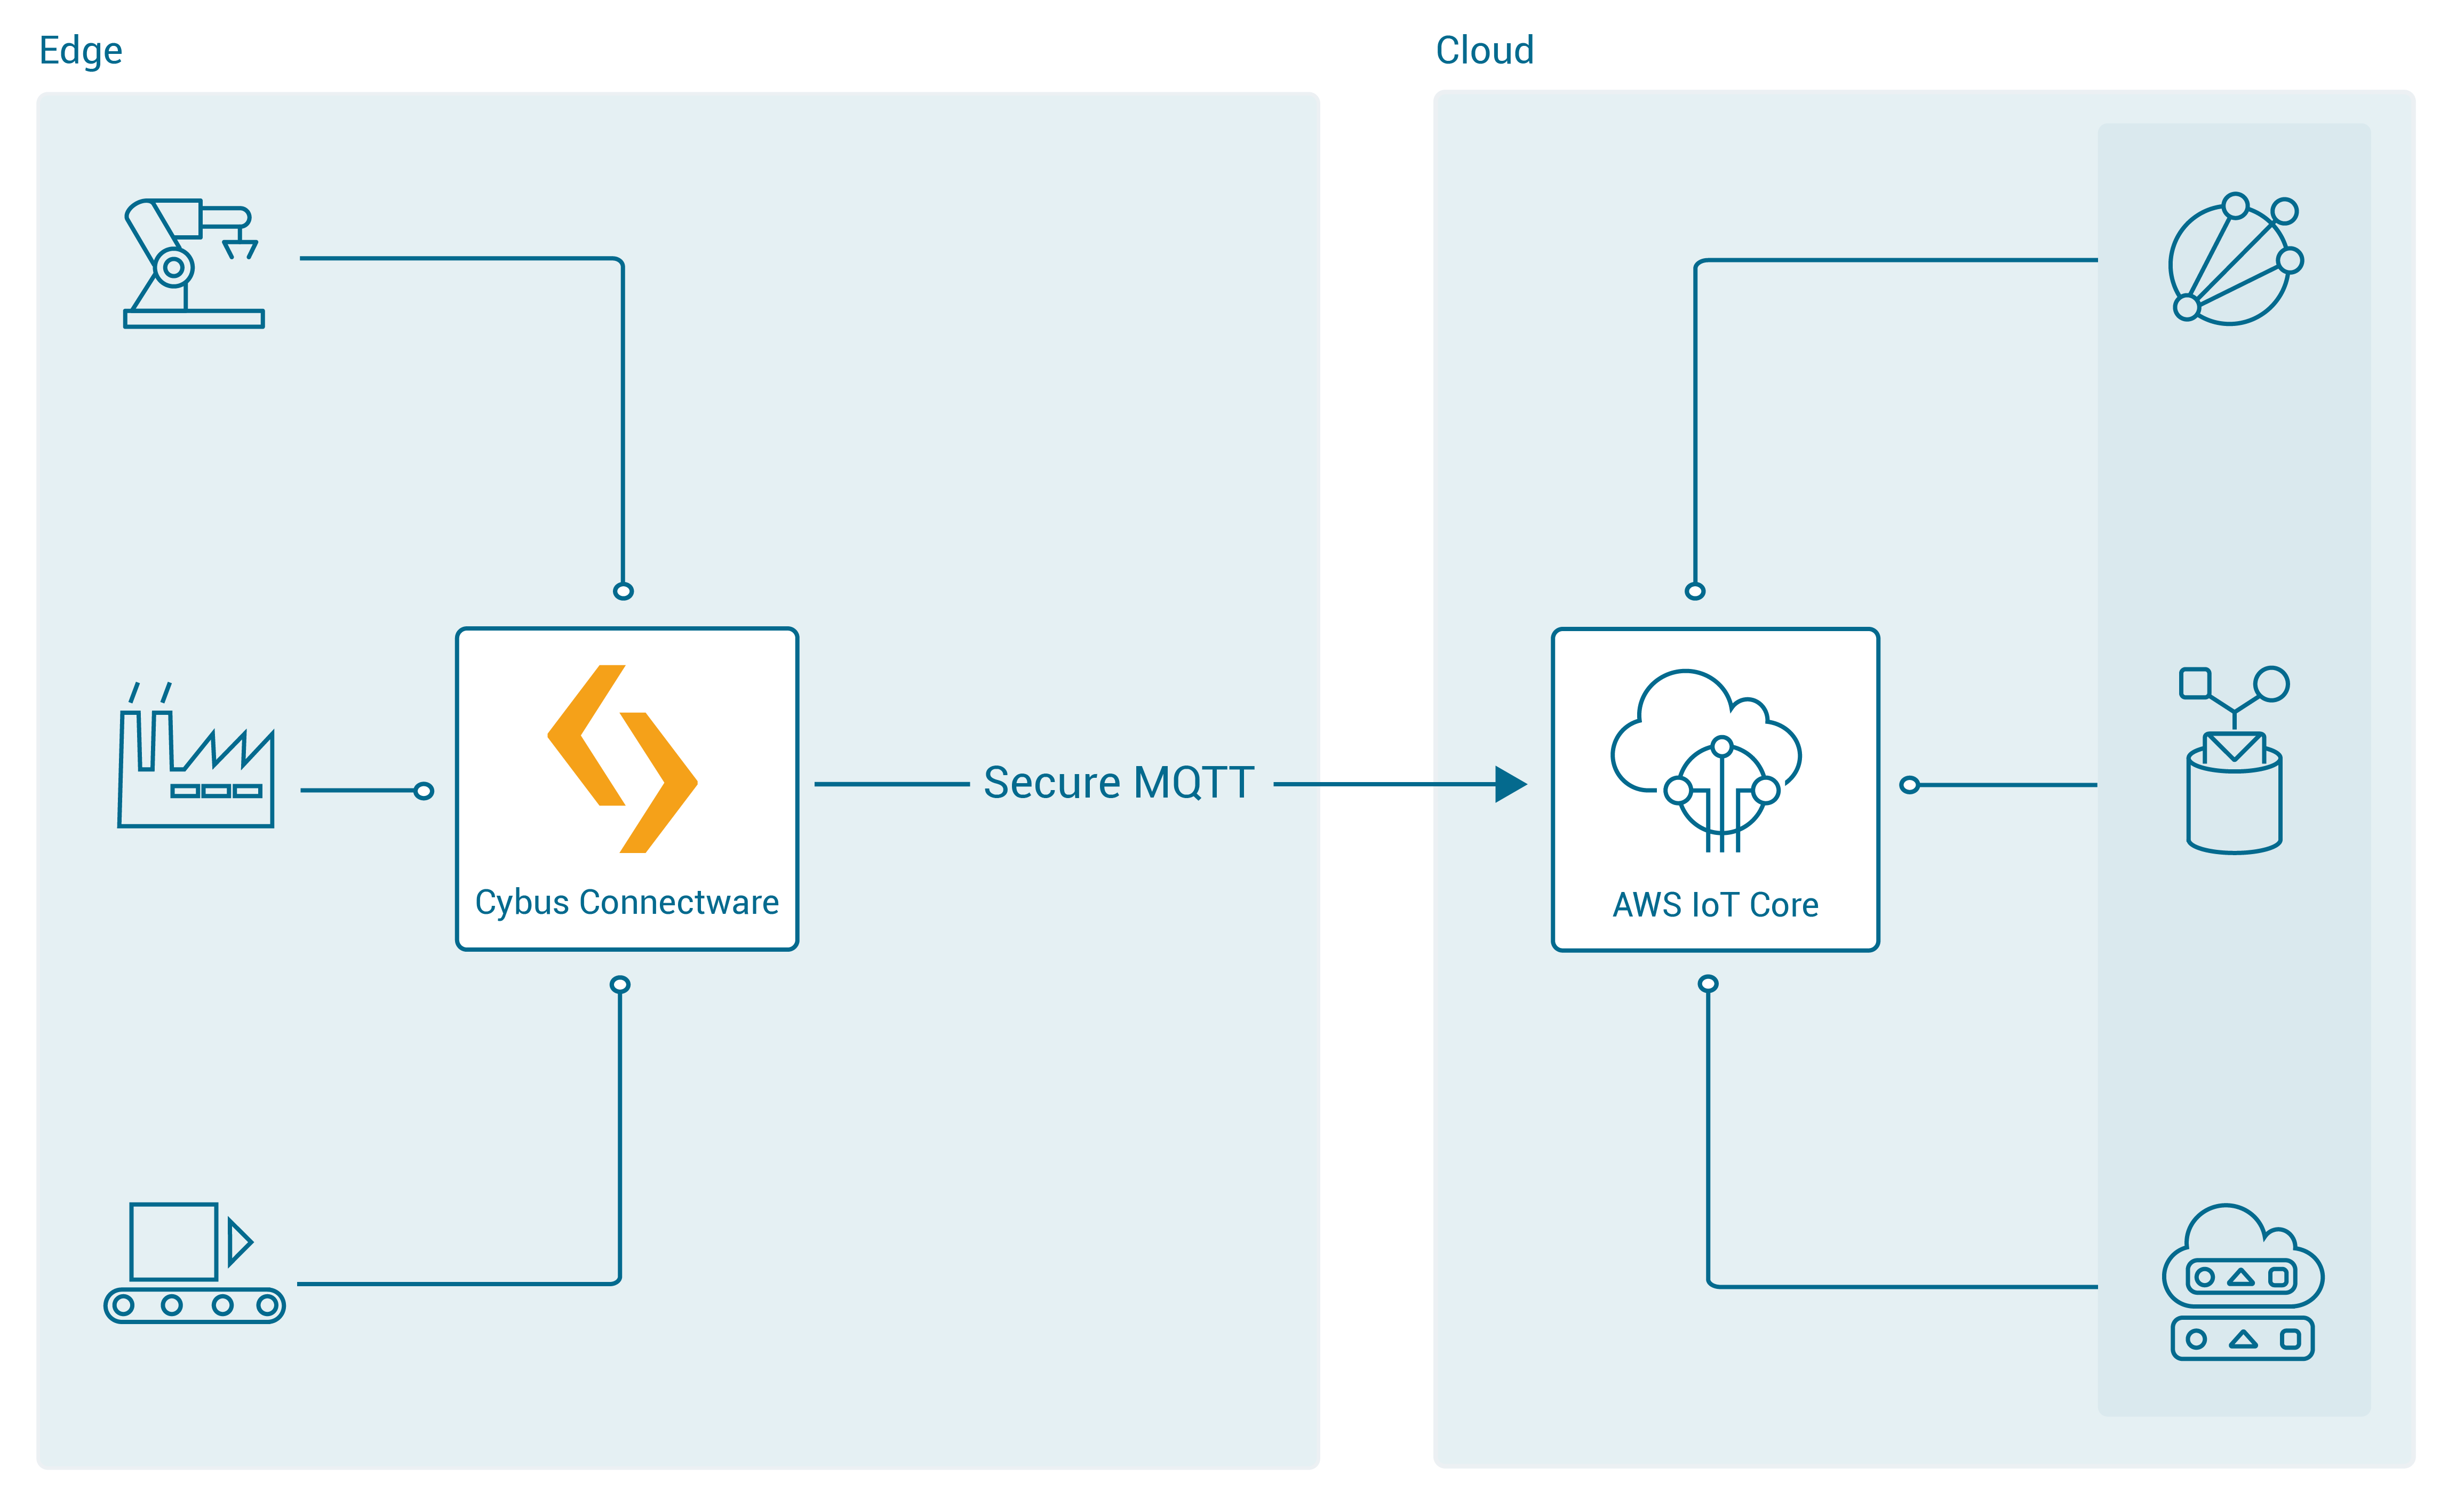
In the second integration scenario, the Connectware is connected to Greengrass Core, which is meant to be deployed as a gateway to the AWS cloud next to the Connectware IIoT Edge Gateway:
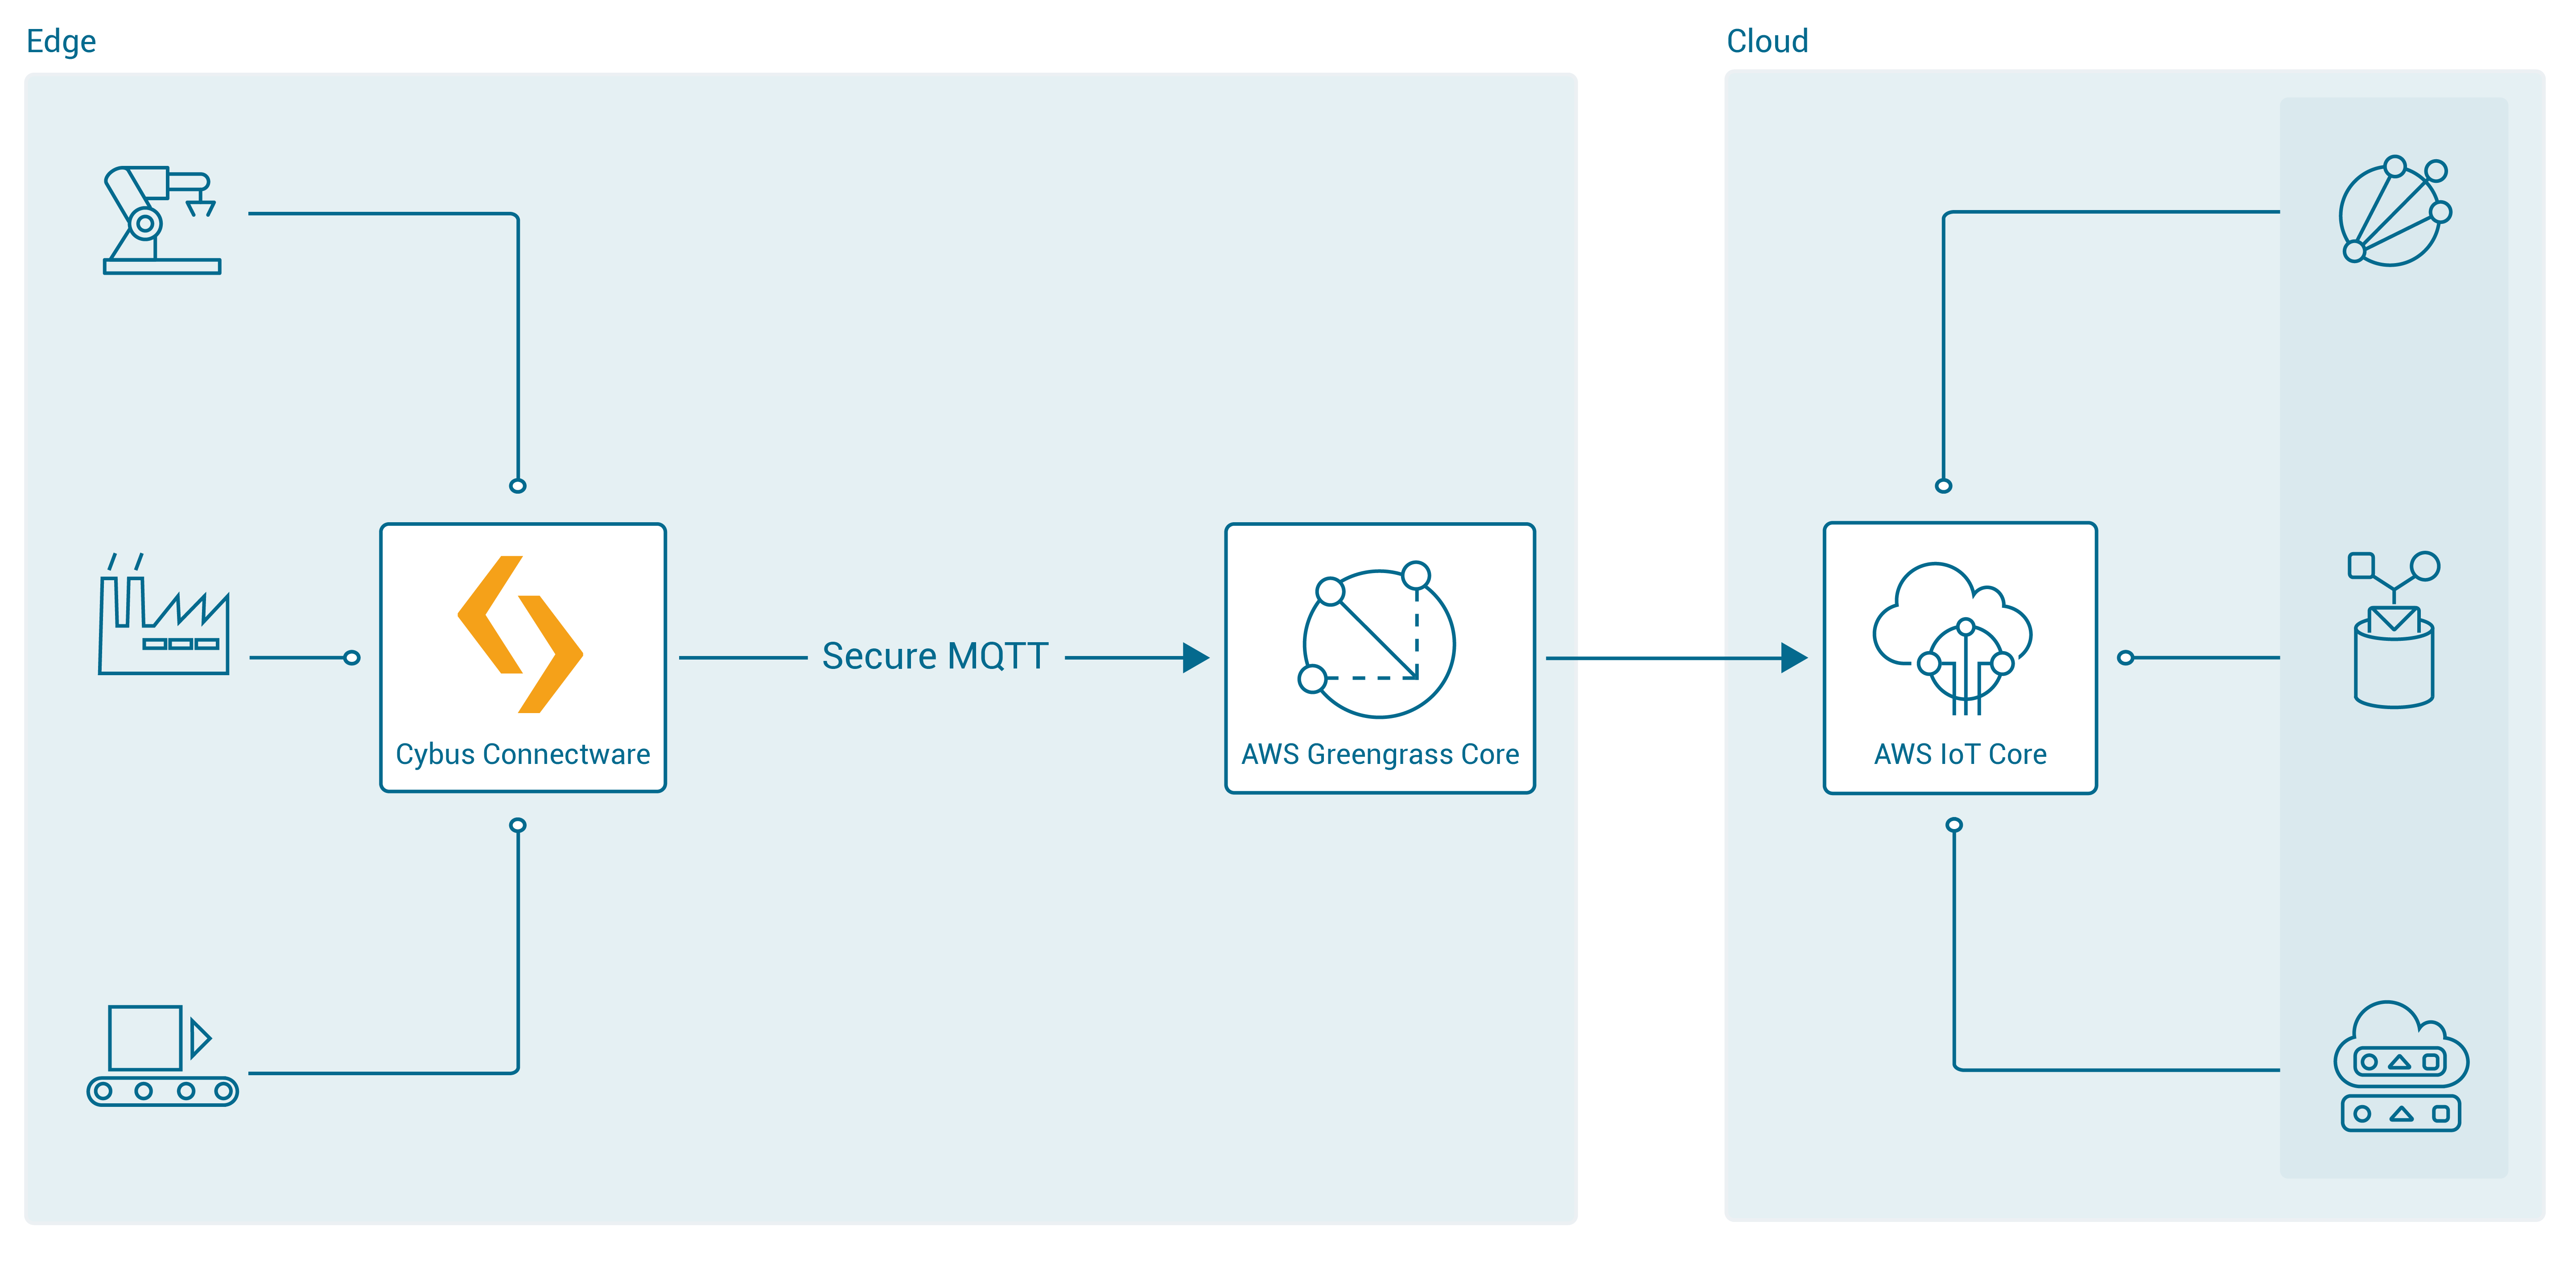
For AWS IoT connections using the Connectware, the following has to be configured:
For details on how to get this information, see the article How to connect AWS IoT and Greengrass. Use the example below to implement a simple AWS IoT service transmitting any data structure in the selected MQTT topic.
The definitions part requires PEM formatted certificates:
You may then configure Endpoint and Mapping resources following the Cybus resource documentation.
The commissioning file below sends any data published on topics ${Cybus::MqttRoot}/test/#topic to AWS IoT into topics TestDevice/$topic with a simple transformation rule.
Make sure you are publishing data on the Connectware broker on the respective topic. The placeholder ${Cybus::MqttRoot} represents the root topic defined as services/<serviceId> after the service is successfully started. The notation #topic/$topic represents a wildcard mapping from any topic name used in subscribe to the same topic name in publish, which has the effect of an MQTT bridge with applied rules like the transformation in the example.
Further details on MQTT topic transformations can be found in the article How to connect an MQTT client to publish and subscribe data.
description: >
  Cybus Connectware to AWS IoT Core
metadata:
  name: AWS IoT Core Test
  version: 1.0.0
  provider: cybus
  homepage: https://www.cybus.io

parameters:
  Aws_IoT_Endpoint_Address:
    type: string
    description: The ATS endpoint to reach your AWS account's AWS IoT Core
    default: <your-aws-account-endpoint-id>-ats.iot.eu-central-1.amazonaws.com

definitions:

  # The root CA certificate as PEM format (AmazonRootCA1.pem)
  caCert: |
    -----BEGIN CERTIFICATE-----
    -----END CERTIFICATE-----
  # The device certificate in PEM CRT format
  clientCert: |
    -----BEGIN CERTIFICATE-----
    -----END CERTIFICATE-----
  # The device private key in PEM format
  clientPrivateKey: |
    -----BEGIN RSA PRIVATE KEY-----
    -----END RSA PRIVATE KEY-----

resources:

  awsMqttConnection:
    type: Cybus::Connection
    properties:
      protocol: Mqtt
      connection:
        host: !ref Aws_IoT_Endpoint_Address
        port: 8883
        scheme: mqtts
        clientId: !sub "${Cybus::ServiceId}-awsMqttConnection"
        mutualAuthentication: true
        caCert: !ref caCert
        clientCert: !ref clientCert
        clientPrivateKey: !ref clientPrivateKey

  sourceTargetMapping:
    type: Cybus::Mapping
    properties:
      mappings:
        - subscribe:
            topic: !sub "${Cybus::MqttRoot}/test/#topic"
          publish:
            connection: !ref awsMqttConnection
            topic: TestDevice/$topic
          rules:
            - transform:
                expression: |
                  (
                    {
                      "deviceId": "TestDevice",
                      "payload": $
                    }
                  )
Code-Sprache: YAML (yaml)In order to connect to a Greengrass Core, the example service commissioning file needs several changes:
See the article How to connect AWS IoT and Greengrass about how to get the Greengrass Group Certificate Authority.
parameters:
...
  awsGreengrassClientId:
    type: string
    default: TestDeviceEdge
...
resources:
  greengrassTestDeviceEdgeMqttConnection:
    type: Cybus::Connection
    properties:
      protocol: Mqtt
      connection:
        host: !ref Greengrass_Core_Endpoint_Address
        port: 8883
        scheme: mqtts
        clientId: !ref awsGreengrassClientId
        mutualAuthentication: true
        caCert: !ref caCert
        clientCert: !ref clientCert
        clientPrivateKey: !ref clientPrivateKey
...
Code-Sprache: YAML (yaml)To implement or maintain a new IIoT Edge integration use case as fast and reliable as possible, there are suitable tools for working with MQTT, Connectware and AWS IoT.
The AWS CLI generally helps with any task on AWS. In this case we have at least two tasks being most efficiently completed using the CLI:
1) Find out the AWS IoT ATS endpoint defined for your AWS account:
aws iot describe-endpoint --endpoint-type iot:Data-ATS
Code-Sprache: YAML (yaml)
The response contains the AWS account specific ATS (Amazon Trust Services) endpoint address to be used as the MQTT hostname:
{
   "endpointAddress": "a7t9...1pi-ats.iot.eu-central-1.amazonaws.com"
}
Code-Sprache: YAML (yaml)
2) Get the Greengrass Group Certificate Authority certificate in case of using AWS IoT Greengrass. You then need the following for the caCert setting in the service commissioning file instead of the Amazon Root CA:
aws greengrass list-groups
aws greengrass list-group-certificate-authorities --group-id "4824ea5c-f042-42be-addc-fcbde34587e7"
aws greengrass get-group-certificate-authority --group-id "4824ea5c-f042-42be-addc-fcbde34587e7"
--certificate-authority-id "3e60c373ee3ab10b039ea4a99eaf667746849e3fd87940cb3afd3e1c8de054af"
Code-Sprache: YAML (yaml)
The JSON Output of the latter call has a field PemEncodedCertificate containing the requested information which needs to be set as the caCert parameter similar to this:
-----BEGIN CERTIFICATE-----
MIIC1TCCAb2gAwIBAgIJANXVxedsqvdKMA0GCSqGSIb3DQEBBQUAMBoxGDAWBgNVBAMTD3d3dy5leGFtcGxlLmNvbTAeFw0yMDEwMDUwNTM4MzRaFw0zMDEwMDMwNTM4MzRaMBoxGDAWBgNVBAMTD3d3dy5leGFtcGxlLmNvbTCCASIwDQYJKoZIhvcNAQEBBQADggEPADCCAQoCggEBAM/0NrS45cm0ovF3+8q8TUzj+E3UH8ldnJJPCQFGMaL+7PoxbO0fYf3ETkEW+dijIZOfus9dSPX7qBDbfilz/HtNppGDem4IjgC52iQl3B1R7TvU8yLNliv43uDDUd+PkzW1cWbUuykr5QPG2sIDSANukosvRdFKO4ydP0Hr9iUdOfbg4k6hMFCrzJubKQqhcBTSsxGtl78abx0Q49shuWr9RRjzqE6mRFa4h0DrKBstgAfmsDRGm4ySBCM7lwxphSsoejb6l39WI/MNU7/U7cGj26ghWHAWp8VCksBOqma8tmr/0BuqcCgKJYaDr1tf4SVxlwU20K+jz0pphdEwSj0CAwEAAaMeMBwwGgYDVR0RBBMwEYIPd3d3LmV4YW1wbGUuY29tMA0GCSqGSIb3DQEBBQUAA4IBAQBkcKC3cgHJGna6OxA5QM3dGM5pEiSXyZt5HWoW8z6wUlYtir6U+mWIb9yg7zaSy9nUOqU4sizQh1HG/Mq9K2WbflGafvfN0wW16uyINdjcfGYDh43UDkXHr5Xzky5XIgt0Fx4BWmjgbLYsza7qpbeIg5ekUYPYQw1Ic2sNpyncmS0eutg4tAO7uzDu1x84WPcZzUjDHKYfupuDXkWroPnHTAxlJ6vtgW976c3Z5rQ5l8bUysWhLBEM8q2OP/zmGDo7fpUHYOKo5qU4h7vGD3t0Pb4ufPOd7XtHuY6HsI2cAPV3tpuetHH6wyAQTG9luhdYrZjAp+ZvlwBm+9nXYp/Y
-----END CERTIFICATE-----
Code-Sprache: YAML (yaml)The Workbench service is basically a Node-RED application running securely on the Connectware as a service. This opens up the possibility to install any Node-RED nodes within the service container for quick prototyping as well as for the production environment. If your use-case cannot be achieved with the above service commissioning file, using the workbench will give you some flexibility and additional tools to prototype your solution using Node-RED modules.
In case of AWS IoT, MQTT connection is enough for most integration scenarios. You may use simple injection nodes and some random value generator in order to implement and test the use northbound to AWS IoT:
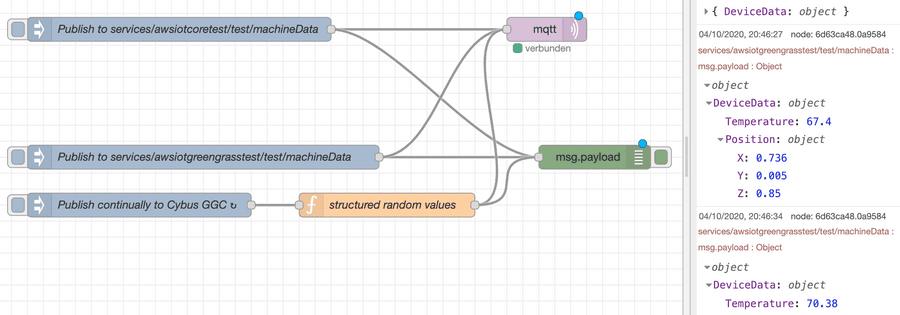
If there are other requirements such as working with shadow devices and other AWS resources, e.g. as part of the IoT Greengrass Core deployment, you may want to use additional Node-RED modules supporting AWS.
If it comes to more complex data management and handling, you may want to use the AWS IoT Device SDK to create a specific Connector Service for Connectware to cover your requirements.
In most cases, it is enough to process any kind of device data and apply rules to them on the Connectware as the most powerful edge gateway tool. Similar capabilities can be used on the near-cloud gateway AWS IoT Greengrass or AWS IoT Core itself to manage rules and transformations near the shadow devices definitions.
What works best depends on your business strategy and technical constraints.
Now that we are successfully sending the data to the IoT Core, we can monitor the transmitted data using various AWS resources.
The obvious tool is the AWS IoT Core MQTT Client offered on the AWS IoT console. With this tool you regularly subscribe to your topic defined in the service commissioning file for outgoing data:
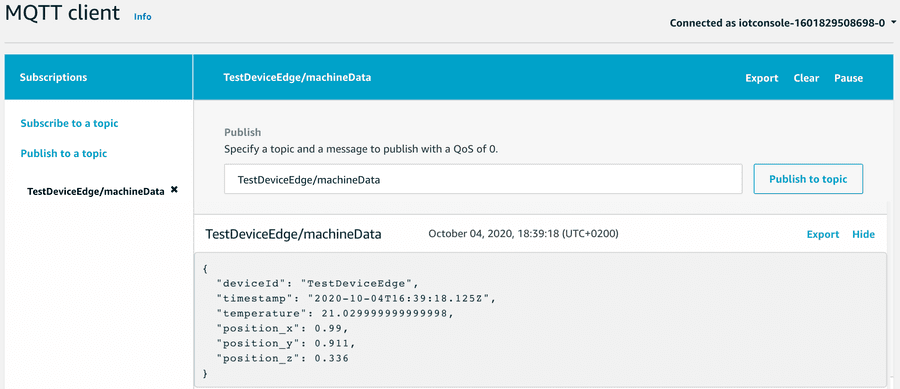
In order to make use of AWS resources, you define AWS IoT rules and define actions appropriately, e.g. transmission to IoT Analytics and a DynamoDB table:
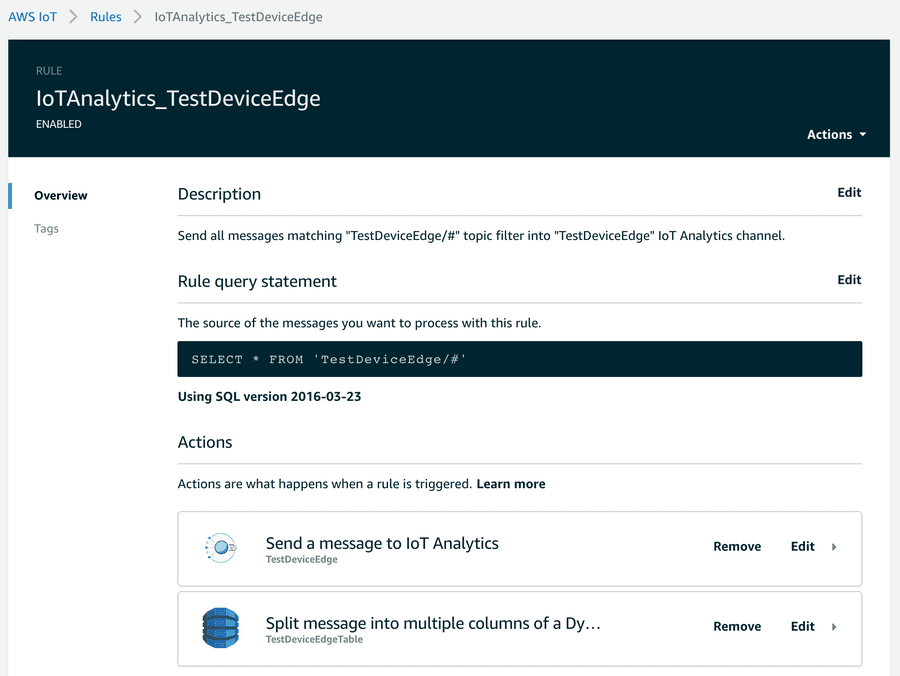
The AWS IoT Console helps to quickly implement data transfer to these endpoints.
An example of how to work with these resources could be a change to the transformation mentioned above to better meet the requirements using the fast and easy mapping support of the Connectware. Given a requirement to flatten an original data object injected into the internal topic, you can easily transform that data using a Connectware transformation rule using Jsonata:
Given a structured object:
"DeviceData": {
    "Temperature": <decimal>,
    "Position": {
        "X": <decimal>,
        "Y": <decimal>,
        "Z": <decimal>
    }
}
Code-Sprache: YAML (yaml)
As an example, the above mentioned mapping could be then enhanced for flattening the elements and adding a timestamp:
  sourceTargetMapping:
...
          rules:
            - transform:
                expression: |
                  (
                    {
                      "deviceId": "TestDeviceEdge",
                      "payload": $
                    }
                  )
            - transform:
                expression: |
                  (
                    {
                      "deviceId": "TestDeviceEdge",
                      "timestamp": $now(),
                      "temperature": $.payload.DeviceData.Temperature,
                      "position_x": $.payload.DeviceData.Position.X,
                      "position_y": $.payload.DeviceData.Position.Y,
                      "position_z": $.payload.DeviceData.Position.Z
                    }
                  )
Code-Sprache: YAML (yaml)
After implementing the use case, you may see the options to shorten things a bit. Connectware then plays its strength with fast integration processes near the connected devices, where most of the data pre-processing can be realized with low latency and fewer costs before transmitting it to the cloud.
The enhanced transformation rule within Connectware mentioned above may be inspired by a requirement to write the data in a well-structured database:
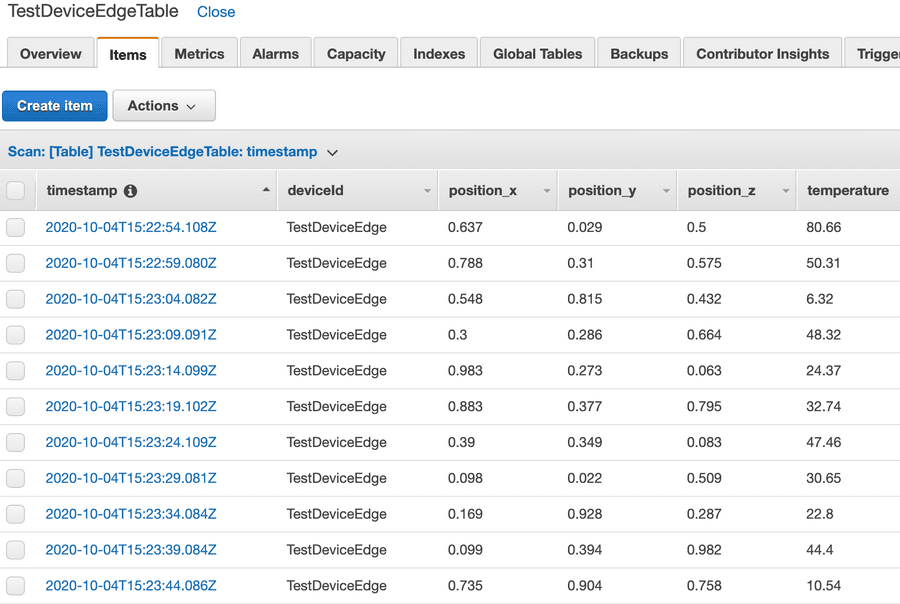
Or the requirement was to create some graph with Amazon Quicksight:
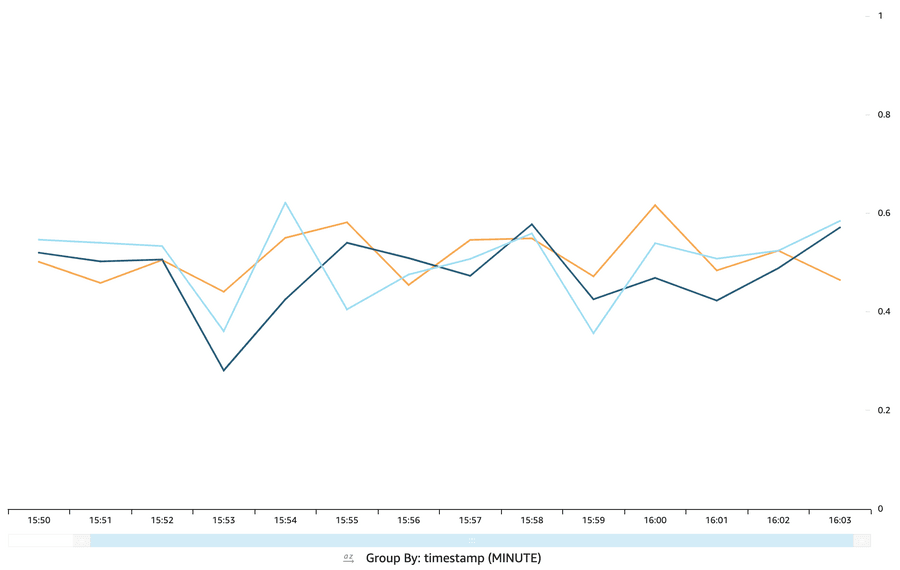
If it comes to the AWS Cloud, there is a vast amount of resources that can be useful to create your IoT Application. You should especially have a look at lambda functions that could be deployed to your IoT Greengrass Core instance.
Other new tools like AWS IoT SiteWise or AWS IoT Things Graph may be useful to build your IoT applications faster with easier management and monitoring.
This lesson first offered a brief introduction to AWS IoT and its components available for integration with other services. Then it explained how to send data from the Connectware MQTT Broker to AWS IoT Core or Greengrass Core with a simple commissioning file using the built-in MQTT connector of Connectware. Furthermore, the Cybus workbench service for prototyping more advanced scenarios was presented. The lesson finished with a description of some basic and advanced tools used to monitor data flow between AWS IoT and Connectware.
This lesson assumes that you want to connect to a Heidenhain controller using the DNC interface protocol with the Cybus Connectware. To understand the basic concepts of Connectware, please check out the Technical Overview lesson. To follow along with the example, you will also need a running instance of Connectware. If you don’t have that, learn How to install the Connectware. Additionally it is not required but will be useful to be familiar with the User Management Basics as well as the lesson How To Connect an MQTT Client.
This article will teach you the integration of Heidenhain controllers. In more detail, the following topics are covered:
The commissioning files used in this lesson are made available in the Example Files Repository on GitHub.
Heidenhain is a manufacturer of measurement and control technology which is widely used for CNC machines. Their controllers provide the Heidenhain DNC interface, also referred to as „option 18“, which enables vertical integration of devices and allows users to access data and functions of a system. The DNC protocol is based on Remote Procedure Calls (RPC), which means it carries out operations by calling methods on the target device. You can find a list of the available methods in the Cybus Docs.
Utilizing Heidenhain DNC with Connectware requires the Cybus Heidenhain Agent running on a Windows machine or server on your network. This agent uses the Heidenhain RemoTools SDK to connect to one or more Heidenhain controllers and communicates to Connectware via MQTT. The Cybus Heidenhain Agent and required dependencies are provided to you by our Support Team.
The host of the Cybus Heidenhain Agent must meet the following requirements:
After successful installation, a windows system service with name „Cybus Heidenhain Agent“ is up and running. It is already configured to automatically start on windows restart and to restart in case of crash. You can always inspect the status under Windows Services and log messages in the Windows Event Viewer.
Go to the Connectware Admin User Interface (Admin UI) and log in.
The agent needs to be able to communicate with Connectware by publishing and subscribing on certain MQTT topics, thus we need to grant this permission. Permissions are bundled within Connectware roles (see User Management Basics). Create the following role:
For this lesson we do not have a machine with a TNC 640 controller available so we will utilize the TNC 640 emulator running on a Windows machine.
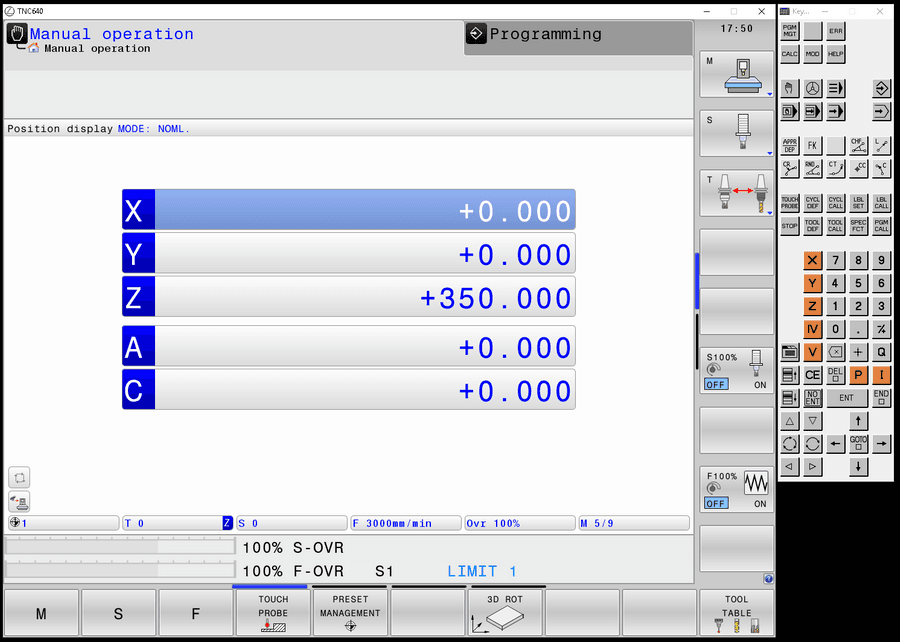
Download the latest version of TNC 640 Programming Station from heidenhain.com and install it to the same machine as the agent or another Windows machine of known IP address in the same network. After the installation you can start the program with the desktop shortcut TNC 640. Once the program is started and you see the tab Power interrupted you can press the CE button on the Keypad to enter the manual mode. The emulator should now also be available on your network.
The most essential information we need to specify the commissioning file for our Heidenhain DNC application is the set of methods of the controller we want to make available with our Connectware. We could just take the whole list from the Cybus Docs and integrate all of the functions to be available on Connectware but to not lose focus in this lesson we will pick a small set of them for demonstration purposes.
We will integrate the following methods:
The Commissioning File is a set of parameters which describes the resources that are necessary to collect and provide all the data for our application. It contains information about all connections, data endpoints and mappings and is read by Connectware. To understand the file’s anatomy in detail, please consult the Cybus Docs.
To get started, open a text editor and create a new file, e.g. heidenhain-example-commissioning-file.yml. The commissioning file is in the YAML format, perfectly readable for humans and machines! We will now go through the process of defining the required sections for this example:
These sections contain more general information about the commissioning file. You can give a short description and add a stack of metadata. Regarding the metadata, only the name is required while the rest is optional. We will just use the following set of information for this lesson:
description: >

  Heidenhain DNC Example Commissioning File
  Cybus Learn - How to connect a machine via Heidenhain DNC interface
  https://learn.cybus.io/lessons/how-to-connect-heidenhain-dnc/

metadata:

  name: Heidenhain DNC Example
  version: 1.0.0
  icon: https://www.cybus.io/wp-content/uploads/2019/03/Cybus-logo-Claim-lang.svg
  provider: Cybus GmbH
  homepage: https://www.cybus.io
Code-Sprache: YAML (yaml)
Parameters allow the user to prepare commissioning files for multiple use cases by referring to them from within the commissioning file. Every time a commissioning file is applied or a service reconfigured in Connectware, the user is asked to enter custom values for the parameters or to confirm the default values.
parameters:
  agentId:
    type: string
    description: Agent Identification (Cybus Heidenhain Agent)
    default: <yourAgentId>
  machineIP:
    type: string
    description: IP Address of the machine
    default: <yourMachineAddress>
  cncType:
    type: string
    default: tnc640
    description: >-
      Type of the machine control (DNC Type). Allowed values: tnc640, itnc530,
      itnc426.
    allowedValues:
      - tnc640
      - itnc530
      - tnc426
Code-Sprache: YAML (yaml)
The parameters we define here could vary from setup to setup, so it is just good to make them configurable. The agentId is the name of the agent’s user in Connectware, which was defined during client registration. The machineIP in our example is the address of the Windows machine running the TNC 640 emulator or would be the address of the machine tool you want to connect to. As parameter cncType we define the type of controller we use and additionally we define the currently supported controller types as allowedValues for this parameter.
In the resources section we declare every resource that is needed for our application. For details about the different resource types and available protocols, please consult the Cybus Docs.
The first resource we need is a connection to the Heidenhain controller. The connection is defined by its type and its type-specific properties. In the case of Cybus::Connection we declare which protocol and connection parameters we want to use. For the definition of our connection we reference the earlier declared parameters agentId, machineIP and cncType by using !ref.
resources:
  heidenhainConnection:
    type: 'Cybus::Connection'
    properties:
      protocol: Heidenhain
      connection:
        agent: !ref agentId
        ipAddress: !ref machineIP
        cncType: !ref cncType
        plcPassword: <password>
        usrPassword: <password>
        tablePassword: <password>
        sysPassword: <password>
Code-Sprache: YAML (yaml)
The access to your TNC 640 controller is restricted by four preconfigured passwords. If you need help to find out the necessary passwords, feel free to contact our Support Team. For ITNC 530 and TNC 426 no password is required.
The next resources needed are the endpoints which will provide or accept data. All endpoints have some properties in common, namely the protocol defined as Heidenhain, the connection which is referenced to the previously defined connection resource using !ref and the optional topic defining on which MQTT topic the result will be published. In the default case the full endpoint topic will expand to services/<serviceId>/<topic>. For more information on that, please consult the Cybus Docs.
The endpoints will make use of the methods we selected earlier. Those methods are all a bit different so let’s take a look at each of the endpoint definitions.
  getStatePolling:
    type: 'Cybus::Endpoint'
    properties:
      protocol: Heidenhain
      connection: !ref heidenhainConnection
      topic: getState
      subscribe:
        method: getState
        type: poll
        pollInterval: 5000
        params: []
Code-Sprache: YAML (yaml)
The first endpoint makes use of the method: getState, which requests the current machine state. The result should be published on the topic: getState. This endpoint is defined with the property subscribe, which in the context of a Heidenhain connection means that it will request the state in frequency of the defined pollInterval. This is also known as polling and brings us to the definition of the type which therefore is poll.
  getState:
    type: 'Cybus::Endpoint'
    properties:
      protocol: Heidenhain
      connection: !ref heidenhainConnection
      topic: getState
      read:
        method: getState
Code-Sprache: YAML (yaml)
But we could also make use of the method getState by requesting the state only once when it is called. The definition of this endpoint differs from the previous in the property read instead of subscribe. To utilize this endpoint and call the method, you need to publish an MQTT message to the topic services/<serviceId>/<topic>/req. The result of the method will be published on the topic services/<serviceId>/<topic>/res. <topic> has to be replaced with the topic we defined for this endpoint, namely getState. The serviceId will be defined during the installation of the service and can be taken from the services list in the Connectware Admin UI.
  getToolTableRow:
    type: 'Cybus::Endpoint'
    properties:
      protocol: Heidenhain
      connection: !ref heidenhainConnection
      topic: getToolTableRow
      read:
        method: getToolTableRow
Code-Sprache: YAML (yaml)
The previously used method getState did not expect any arguments so we could just call it by issuing an empty message on the req topic. The method getToolTableRow is used to request a specific row of the tool table. To specify which row should be requested, we need to supply the toolId. We will look at an example of this method call in the last section of the article.
  getPlcData:
    type: 'Cybus::Endpoint'
    properties:
      protocol: Heidenhain
      connection: !ref heidenhainConnection
      topic: getPlcData
      read:
        method: getPlcData
Code-Sprache: YAML (yaml)
Using the method getPlcData allows us to request data stored on any memory address of the controller. The arguments that must be handed over are the memoryType and the memoryAddress.
  transmitFile:
    type: 'Cybus::Endpoint'
    properties:
      protocol: Heidenhain
      connection: !ref heidenhainConnection
      topic: transmitFile
      read:
        method: transmitFile
Code-Sprache: YAML (yaml)
The method transmitFile allows us to transmit a file in the form of a base64-encoded buffer to a destination path on the Heidenhain controller. It expects two arguments: the string fileBuffer and another string destinationPath.
  onToolTableChanged:
    type: 'Cybus::Endpoint'
    properties:
      protocol: Heidenhain
      connection: !ref heidenhainConnection
      topic: notify/onToolTableChanged
      subscribe:
        type: notify
        method: onToolTableChanged
Code-Sprache: YAML (yaml)
The last endpoint we define calls the method onToolTableChanged. This is an event method which will send a notification in case of a changed tool table. For this we have to use the property subscribe along with the type notify. This means that we are not polling the method in this context but subscribe to it and wait for a notification on the specified topic. We could trigger a notification by modifying the tool table in the TNC emulator.
You now have the commissioning file ready for installation. Head over to the Services tab in the Connectware Admin UI and hit the (+) button to select and upload the commissioning file. You will be asked to specify values for each member of the section parameters or confirm the default values. With a proper written commissioning file, the confirmation of this dialog will result in the installation of a service, which manages all the resources we just defined: The connection to the Heidenhain controller and the endpoints collecting data from the controller. After enabling this service you are good to go on and see if everything works out!
The Heidenhain agent running on the Windows machine tries to connect to Connectware at the IP address that was defined during its installation, as soon as it is started. We recognized these connection attempts when we opened the Connectware client registry and accepted the request of the Heidenhain agent with the name heidenhain-<windows-pc-hostname>. As a result a user with this name was created in Connectware. We manually assigned this user the role heidenhainagent and through that granted the permission to access the MQTT topic for data exchange.
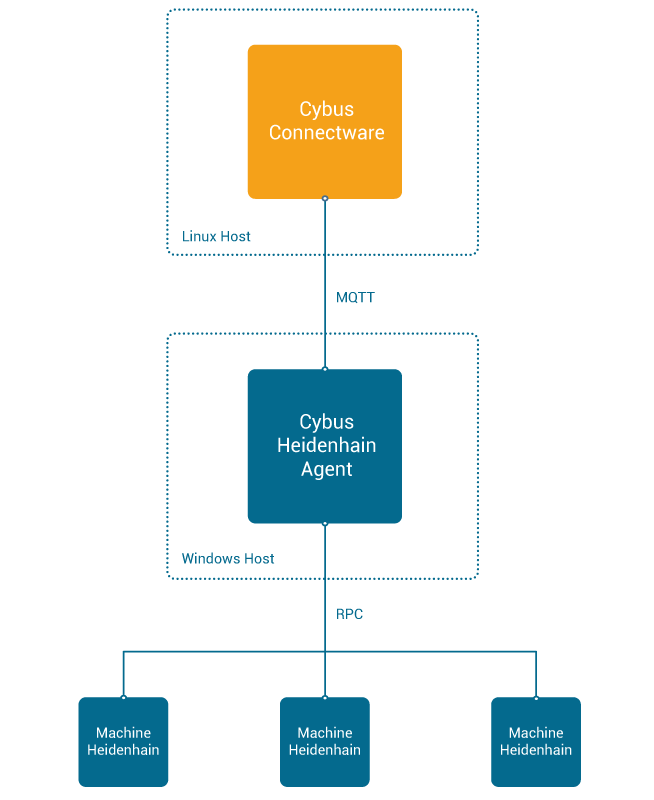
After the installation of the service in Connectware it tries to establish the Heidenhain connection we declared in the resources section of the commissioning file. There we have defined the name of the Heidenhain agent and the IP address of the Heidenhain controller to connect to, or in our case of the emulator, which runs on the same machine as the agent. (Working with a real machine controller that would obviously not be the case.) As soon as the connection to the Heidenhain controller is established the service enables the endpoints which rely on the method calls issued by the agent to the Heidenhain controller via RPC. To address multiple Heidenhain controllers we could utilize the same agent but need to specify separate connection resources for each of them.
Now that we have a connection established between the Heidenhain controller and Connectware, we can go to the Explorer tab of the Admin UI, where we see a tree structure of our newly created data points. Since we subscribed to the method getState, we should already see data being polled and published on this topic. Find the topic getState under services/heidenhaindncexample.
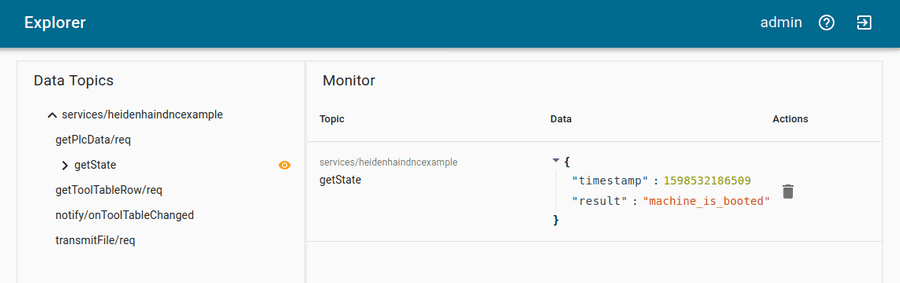
On MQTT topics the data is provided in JSON format. To utilize a method that expects arguments you would issue a request by publishing a message on the belonging req topic with the arguments as payload. For example to use the endpoint getToolTableRow you could publish the following message to request the tool information of tool table ID 42:
{
  "id": "1",
  "params": [ "42" ]
}
Code-Sprache: YAML (yaml)
The payload must be a valid JSON object and can contain two properties:
id: (optional) User-defined correlation ID which can be used to identify the response. If this property was given, its value will be returned in the return messageparams: Array of parameters required for the used method. If the method requires no parameters, this property is optional, too.The arguments required for each call are listed along with the methods in the Cybus Docs.
The answer you would receive to this method call could look as follows:
{
  "timestamp":1598534586513,
  "result":
  {
    "CUR_TIME":"0",
    "DL":"+0",
    "DR":"+0",
    "DR2":"+0",
    "L":"+90",
    "NAME":"MILL_D24_FINISH",
    "PLC":"%00000000",
    "PTYP":"0",
    "R":"+12",
    "R2":"+0",
    "T":"32",
    "TIME1":"0",
    "TIME2":"0"
  },
  "id":"1"
}
Code-Sprache: YAML (yaml)
To learn how you can easily test and interact with MQTT topics like in this example, check out the article How to connect MQTT clients. Utilizing the Workbench you could simply hit Import from the menu in the upper right corner and import the nodered-flow.json from the Example Repository to add the test flow shown below. Add your MQTT credentials to the purple subscribe and publish nodes, then trigger requests.
[{"id":"cba40915.308b38","type":"tab","label":"Heidenhain DNC Demo","disabled":false,"info":""},{"id":"bc623e05.ae0f7","type":"inject","z":"cba40915.308b38","name":"Trigger "getState" request (see here for payload)","props":[{"p":"payload"},{"p":"topic","vt":"str"}],"repeat":"","crontab":"","once":false,"onceDelay":0.1,"topic":"","payload":"{"id":"1","params":[]}","payloadType":"json","x":240,"y":200,"wires":[["aff3fdcf.d275d","9fd44184.a11d1"]]},{"id":"f450d307.396ee","type":"comment","z":"cba40915.308b38","name":"Demo for Cybus Learn Article "How to connect a machine via Heidenhain DNC interface"","info":"","x":360,"y":60,"wires":[]},{"id":"aff3fdcf.d275d","type":"mqtt out","z":"cba40915.308b38","name":"","topic":"services/heidenhaindncexample/getState/req","qos":"0","retain":"false","broker":"b7832f1d.e9d4e","x":630,"y":200,"wires":[]},{"id":"ddec5b0c.c0c418","type":"mqtt in","z":"cba40915.308b38","name":"","topic":"services/heidenhaindncexample/getState/res","qos":"0","datatype":"auto","broker":"b7832f1d.e9d4e","x":230,"y":300,"wires":[["e1df9994.c3edc8"]]},{"id":"21f886a8.ac3a2a","type":"debug","z":"cba40915.308b38","name":"","active":true,"tosidebar":true,"console":false,"tostatus":false,"complete":"false","statusVal":"","statusType":"auto","x":650,"y":300,"wires":[]},{"id":"dc2c1840.954bb8","type":"comment","z":"cba40915.308b38","name":"getState request","info":"","x":140,"y":160,"wires":[]},{"id":"668e0f37.4f5","type":"comment","z":"cba40915.308b38","name":"getState response","info":"","x":150,"y":266,"wires":[]},{"id":"ec1150ad.7a23d","type":"inject","z":"cba40915.308b38","name":"Trigger "getToolTableRow" request (see here for payload)","props":[{"p":"payload"},{"p":"topic","vt":"str"}],"repeat":"","crontab":"","once":false,"onceDelay":0.1,"topic":"","payload":"{"id":"2","params":["42"]}","payloadType":"json","x":270,"y":498,"wires":[["d317feb3.3eb0b","4c3ab86e.f653b8"]]},{"id":"d317feb3.3eb0b","type":"mqtt out","z":"cba40915.308b38","name":"","topic":"services/heidenhaindncexample/getToolTableRow/req","qos":"0","retain":"false","broker":"b7832f1d.e9d4e","x":720,"y":498,"wires":[]},{"id":"5a2f9aca.f82724","type":"mqtt in","z":"cba40915.308b38","name":"","topic":"services/heidenhaindncexample/getToolTableRow/res","qos":"0","datatype":"auto","broker":"b7832f1d.e9d4e","x":260,"y":600,"wires":[["3ad07f7c.3bf85"]]},{"id":"b888e063.a8f84","type":"debug","z":"cba40915.308b38","name":"","active":true,"tosidebar":true,"console":false,"tostatus":false,"complete":"false","statusVal":"","statusType":"auto","x":710,"y":600,"wires":[]},{"id":"65db090f.922aa8","type":"comment","z":"cba40915.308b38","name":"getToolTableRow request","info":"","x":170,"y":458,"wires":[]},{"id":"23d593fd.e852ac","type":"comment","z":"cba40915.308b38","name":"getToolTableRow response","info":"","x":170,"y":564,"wires":[]},{"id":"3ad07f7c.3bf85","type":"json","z":"cba40915.308b38","name":"","property":"payload","action":"","pretty":false,"x":550,"y":600,"wires":[["b888e063.a8f84"]]},{"id":"e1df9994.c3edc8","type":"json","z":"cba40915.308b38","name":"","property":"payload","action":"","pretty":false,"x":490,"y":300,"wires":[["21f886a8.ac3a2a"]]},{"id":"9fd44184.a11d1","type":"debug","z":"cba40915.308b38","name":"","active":true,"tosidebar":true,"console":false,"tostatus":false,"complete":"false","statusVal":"","statusType":"auto","x":530,"y":160,"wires":[]},{"id":"4c3ab86e.f653b8","type":"debug","z":"cba40915.308b38","name":"","active":true,"tosidebar":true,"console":false,"tostatus":false,"complete":"false","statusVal":"","statusType":"auto","x":590,"y":460,"wires":[]},{"id":"b7832f1d.e9d4e","type":"mqtt-broker","z":"","name":"Connectware","broker":"connectware","port":"1883","clientid":"","usetls":false,"compatmode":false,"keepalive":"60","cleansession":true,"birthTopic":"","birthQos":"0","birthPayload":"","closeTopic":"","closeQos":"0","closePayload":"","willTopic":"","willQos":"0","willPayload":""}]
Code-Sprache: YAML (yaml)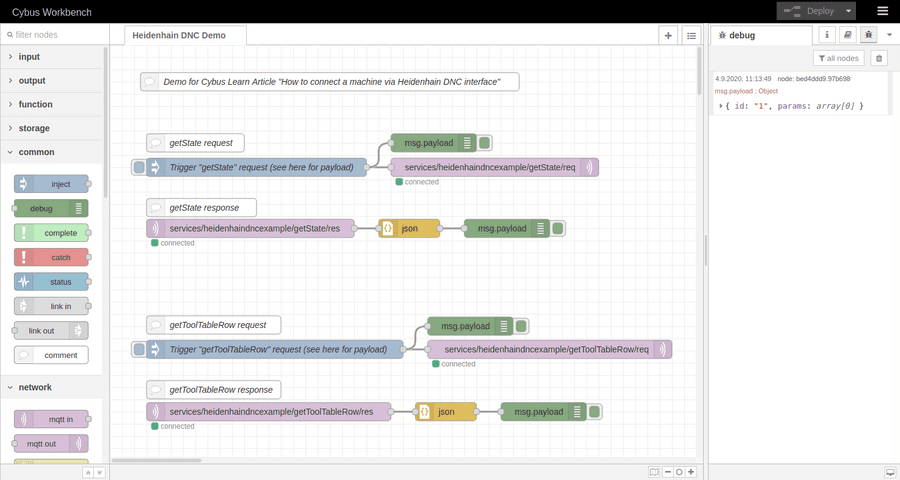
In this article we went through the process of setting up a connection between a Heidenhain controller and the Cybus Connectware via the Heidenhain DNC interface. This required the Cybus Heidenhain agent to translate between Connectware and Heidenhain DNC by making use of the RemoTools SDK. We wrote the commissioning file that set up the Connectware service which connected to an emulated instance of a TNC 640 and requested and received information about the tool with ID 42. This or any other data from the Heidenhain DNC interface could now securely be vertically integrated along with data from any other interface through the unified API of Connectware.
Connectware offers powerful features to build and deploy applications for gathering, filtering, forwarding, monitoring, displaying, buffering, and all kinds of processing data… why not build a dashboard for instance? For guides check out more of Cybus Learn.
MQTT as an open network protocol and OPC UA as an industry standard for data exchange are the two most common players in the IIoT sphere. Often, MQTT (Message Queuing Telemetry Transport) is used to connect various applications and systems, while OPC UA (Open Platform Communications Unified Architecture) is used to connect machines. Additionally, there are also applications and systems that support OPC UA, just as there are machines or devices that support MQTT. Therefore, when it comes to providing communication between multiple machines/devices and applications that support different protocols, a couple of questions might arise. First, how to bridge the gap between the two protocols, and second, how to do it in an efficient, sustainable, secure and extensible way.
This article discusses the main aspects of MQTT and OPC UA and illustrates how these protocols can be combined for IIoT solutions. The information presented here would thus be useful for IIoT architects.
Both protocols are the most supported and most utilized in the IIoT. MQTT originated in the IT sphere and is supported by major IoT cloud providers, such as Azure, AWS, Google, but also by players specialized in industrial use cases, e.g. Adamos, Mindsphere, Bosch IoT, to name a few. The idea behind MQTT was to invent a very simple yet highly reliable protocol that can be used in various scenarios (for more information on MQTT, see MQTT Basics). OPC UA, on the contrary, was created by an industry consortium to boost interoperability between machines of different manufacturers. As MQTT, this protocol covers core aspects of security (authentication, authorization and encryption of the data) and, besides, meets all essential industrial security standards.
IIoT use cases are complex, because they bring together two distinct environments – Information Technology (IT) and Operational Technology (OT). Traditionally, the IT and OT worlds were separated from each other, had different needs and thus developed very different practices. One of such dissimilarities is the dependence on different communication protocols. The IT world is primarily influenced by higher level applications, web technology and server infrastructure, so the adoption of MQTT as an alternative to HTTP is on the rise there. At the same time, in the OT world, OPC UA is the preferable choice due to its ability of providing a perfectly described interface to industrial equipment.
Today, however, the IT and OT worlds gradually converge as the machine data generated on the shopfloor (OT) is needed for IIoT use cases such as predictive maintenance or optimization services that run in specialized IT applications and often in the cloud. Companies can therefore benefit from combining elements from both fields. For example, speaking of communication protocols, they can use MQTT and OPC UA along with each other. A company can choose what suits well for its use case’s endpoint and then bridge the protocols accordingly. If used properly, the combination of both protocols ensures greatest performance and flexibility.
As already mentioned above, applications usually rely on MQTT and machines on OPC UA. However, it is not always that straightforward. Equipment may also speak MQTT and MES systems may support OPC UA. Some equipment and systems may even support both protocols. On top of that, there are also numerous other protocols apart from MQTT and OPC UA. All this adds more dimensions to the challenge of using data in the factory.
This IIoT challenge can, however, be solved with the help of middleware. The middleware closes the gap between the IT and OT levels, it enables and optimises their interaction. The Cybus Connectware is such a middleware.
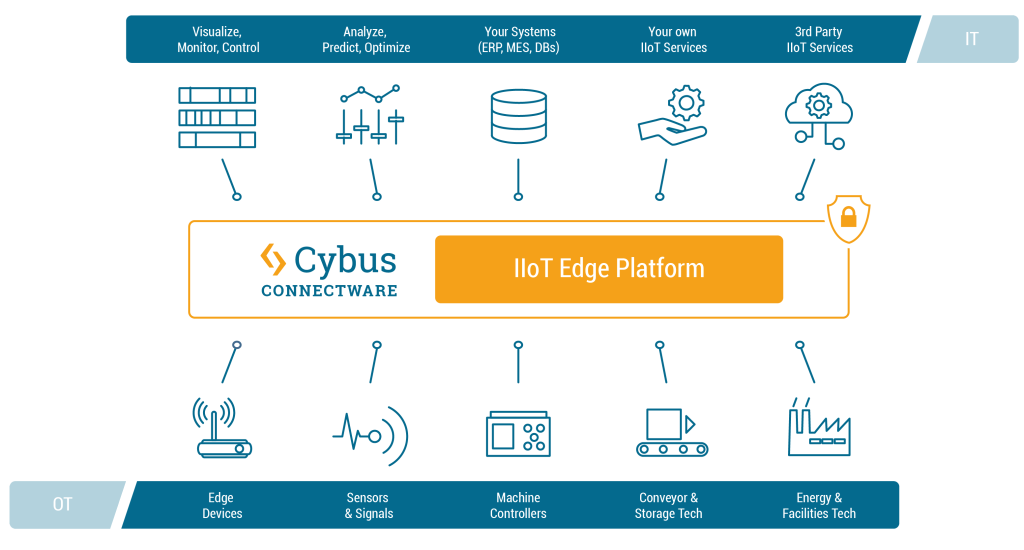
The Cybus Connectware supports a broad variety of protocols – including MQTT and OPC UA – and thus makes it possible to connect nearly any sort of IT application with nearly any sort of OT equipment. In the case of OPC UA and MQTT, the bridging of two protocols is achieved through connecting four parties: OPC UA Client, OPC UA Server, MQTT Client and MQTT Broker. The graphic below illustrates how the Cybus Connectware incorporates these four parties.
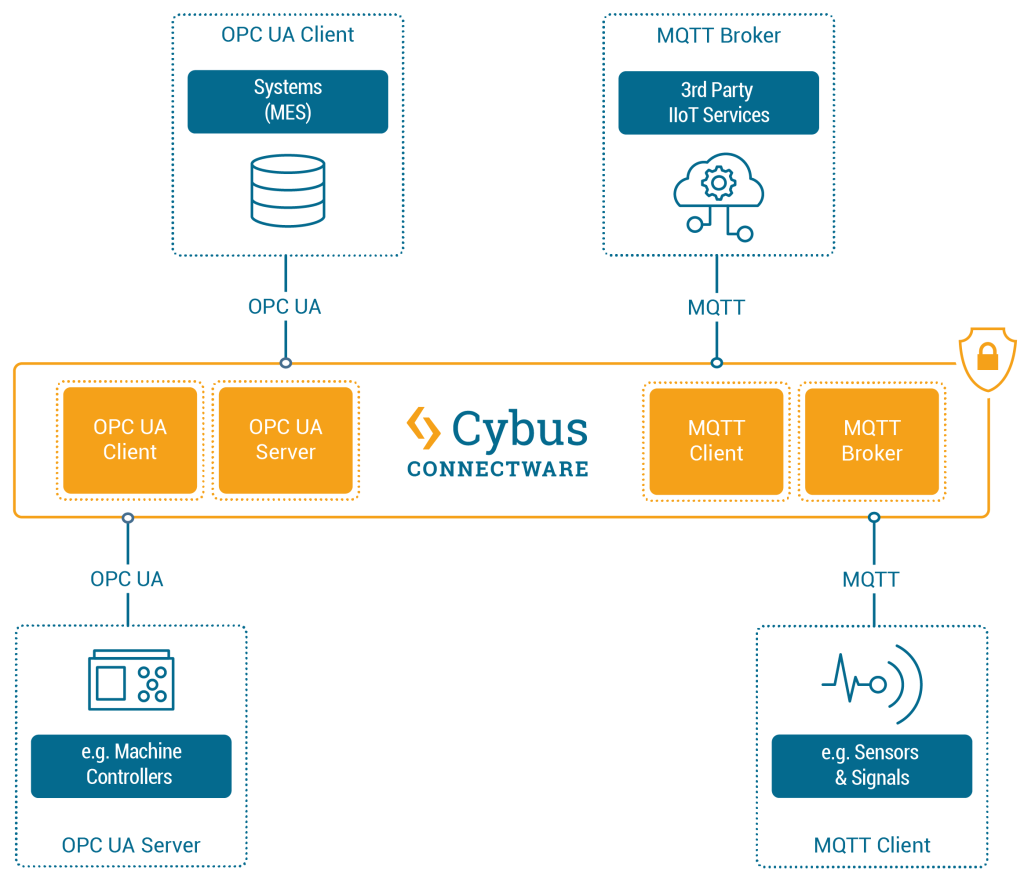
On the machines layer, different equipment can be connected to Connectware. For example, if a device such as a CNC controller (e.g. Siemens SINUMERIK) that uses OPC UA should be connected, then Connectware will serve as the OPC UA Client and the controller as the OPC UA Server. While connecting a device that supports MQTT (e.g. a retrofit sensor), Connectware will act as the MQTT broker, and the sensor will be the MQTT client.
Likewise, various applications can be connected to Connectware on the applications layer. In case of connecting services that support MQTT (e.g. Azure IoT Hub or AWS IoT / Greengrass), Connectware will act as the MQTT client, while those services will act as MQTT brokers. If connecting systems that support OPC UA (e.g. MES), Connectware will play the role of the OPC UA Server, while the systems will act as OPC UA clients.
The question may arise as to why not connect applications or systems that support a specific protocol directly to devices that support the same protocol, e.g. a SINUMERIK machine controller to a MES (which both “speak” OPC UA), or a retrofit sensor to the Azure IoT Hub (which both can communicate via MQTT)? Although this is theoretically possible, in practice it comes with fundamental disadvantages that can quickly become costly problems. A tightly coupled system like this requires far more effort as well as in depth protocol and programming skills. Such a system is then cumbersome to administer and not scalable. Most importantly, it lacks agility when introducing changes such as adding new data sources, services or applications. Thus a “pragmatic” 1:1 connectivity approach actually slows down the IIoT responsibles’ ability for business enablement where it is really needed to accelerate.
At this point, it is worth moving from the very detailed example of MQTT and OPC UA to a broader picture, because IIoT is a topic full of diversity and dynamics.
In contrast to the 1:1 connectivity approach, the Connectware IIoT Edge Platform enables (m)any-to-(m)any connectivity between pretty much any OT and IT data endpoints. From a strategic point of view, Connectware, acting as a “technology-neutral layer”, provides limitless compatibility in the IIoT ecosystem while maintaining convenient independence from powerful providers and platforms. It provides a unified, standardised and systematic environment that is made to fit expert users’ preferences. On this basis, IIoT responsibles can leverage key tactical benefits such as data governance, workflow automation and advanced security. You can read more about these aspects and dive into more operational capabilities in related articles.
Sie müssen den Inhalt von reCAPTCHA laden, um das Formular abzuschicken. Bitte beachten Sie, dass dabei Daten mit Drittanbietern ausgetauscht werden.
Mehr InformationenSie sehen gerade einen Platzhalterinhalt von Facebook. Um auf den eigentlichen Inhalt zuzugreifen, klicken Sie auf die Schaltfläche unten. Bitte beachten Sie, dass dabei Daten an Drittanbieter weitergegeben werden.
Mehr InformationenSie sehen gerade einen Platzhalterinhalt von Instagram. Um auf den eigentlichen Inhalt zuzugreifen, klicken Sie auf die Schaltfläche unten. Bitte beachten Sie, dass dabei Daten an Drittanbieter weitergegeben werden.
Mehr InformationenSie sehen gerade einen Platzhalterinhalt von X. Um auf den eigentlichen Inhalt zuzugreifen, klicken Sie auf die Schaltfläche unten. Bitte beachten Sie, dass dabei Daten an Drittanbieter weitergegeben werden.
Mehr Informationen