-
Use Cases
Industrien
Getting started
-
Insights & Wissen
Für User
Support
In this lesson, we will send data from Cybus Connectware to an Elasticsearch Cluster.
As a prerequisite, it is necessary to set up the Connectware instance and the Elasticsearch instance to be connected. In case of joining a more advanced search infrastructure, a Logstash instance between Connectware and the Elasticsearch cluster may be useful.
We assume you are already familiar with Cybus Connectware and its service concept. If not, we recommend reading the articles Connectware Technical Overview and Service Basics for a quick introduction. Furthermore, this lesson requires basic understanding of MQTT and how to publish data on an MQTT topic. If you want to refresh your MQTT knowledge, we recommend looking at the lessons MQTT Basics and How to connect an MQTT client to publish and subscribe data.
This article provides general information about Elasticsearch and its role in the Industrial IoT context along with a hands-on section about the Cybus Connectware integration with Elasticsearch.
If you are already familiar with Elasticsearch and its ecosystem, jump directly to the hands-on section. See: Using Filebeat Docker containers with Cybus Connectware.
The article concludes by describing some aspects of working with relevant use cases for prototyping, design decisions and reviewing the integration scenario.
Elasticsearch is an open-source enterprise-grade distributed search and analytics engine built on Apache Lucene. Lucene is a high-performance, full-featured text search engine programming library written in Java. Since its first release in 2010, Elasticsearch has become widely used for full-text search, log analytics, business analytics and other use cases.
Elasticsearch has several advantages over classic databases:
Mastering these features is a known challenge, since working with Elasticsearch and search indices in general can become quite complex depending on the use case. The operational effort is also higher, but this can be mitigated by using managed Elasticsearch clusters offered by different cloud providers.
Elasticsearch inherently comes with a log aggregator engine called Logstash, a visualization and analytics platform called Kibana and a collection of data shippers called Beats. These four products are part of the integrated solution called the “Elastic Stack”. Please follow the links above to learn more about it.
When it comes to Industrial IoT, we speak about collecting, enriching, normalizing and analyzing huge amounts of data ingested at a high rate even in smaller companies. This data is used to gain insights into production processes and optimize them, to build better products, to perform monitoring in real time, and last but not least, to establish predictive maintenance. To benefit from this data, it needs to be stored and analyzed efficiently, so that queries on that data can be made in near real time.
Here a couple of challenges may arise. One of them could be the mismatch between modern data strategies and legacy devices that need to be integrated into an analytics platform. Another challenge might be the need to obtain a complete picture of the production site, so that many different devices and technologies can be covered by an appropriate data aggregation solution.
Some typical IIoT use cases with the Elastic Stack include:
Elastic Stack has become one of several solutions for realizing such use cases in a time and cost efficient manner, and the good thing is that Elasticsearch can be easily integrated into the shop floor with Cybus Connectware.
Cybus Connectware is an ideal choice for this because its protocol abstraction layer is not only southbound protocol agnostic, supporting complex shop floor environments with many different machines, but also agnostic to the northbound systems. This means that customers can remain flexible and realize various use cases according to their specific requirements. For example, migrating a Grafana-based local monitoring system to Kibana, an Elastic Stack-based real time monitoring Dashboard, is a matter of just a few changes.
The learning curve for mastering Elasticsearch is steep for users who try it for the first time. Maintaining search indices and log shippers can also be complex for some use cases. In those cases, it might be easier and more efficient to integrate machines into an IIoT edge solution, such as Connectware.
Here are some benefits of using Cybus Connectware at the edge to stream data to Elasticsearch:
Nevertheless, when ingesting data the Filebeat and Logstash data processing features may also be very useful for normalizing data for all data sources, not just IIoT data from OT networks.
Before proceeding further, you should first obtain access credentials for an existing Elasticsearch cluster, or set up a new one. For this, follow the instructions below:
The simplest and most reliable way of communication when integrating Cybus Connectware with Elasticsearch is the MQTT Input for a Filebeat instance. An additional advantage of the Connectware MQTT connector is built-in data buffering, which means that data is stored locally when there is temporary connection failure between the Filebeat and the Elasticsearch Cluster:
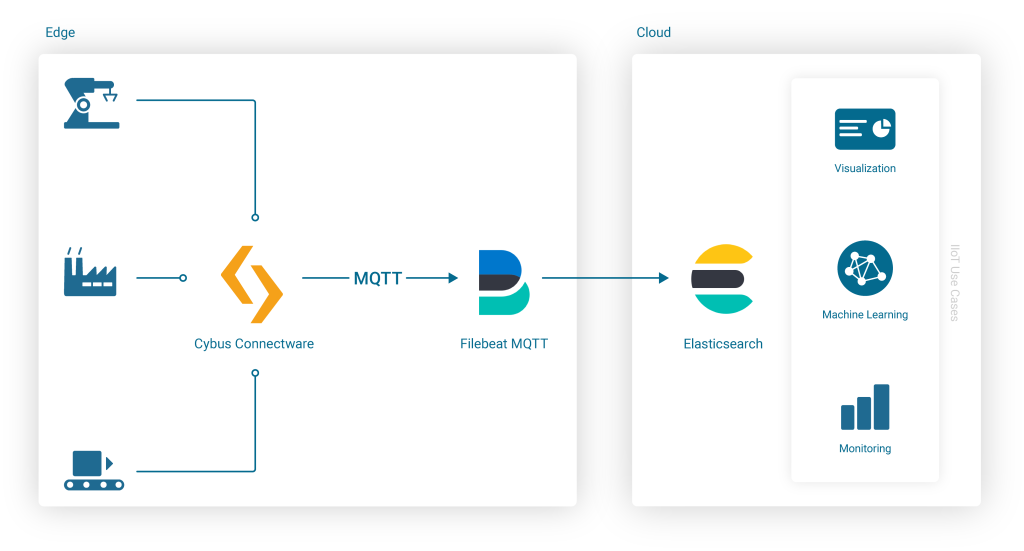
Embedding the Filebeat Docker Image into Connectware is easy because Connectware comes with an integrated interface for running Edge Applications. Once started, the docker container connects to the integrated Connectware Broker to fetch and process the data of interest.
All you have to do is to create a Connectware Service by writing a Commissioning File and install it on the Connectware instance. To learn more about writing Commissioning Files and Services, head over to the Learn Article called Service Basics.
Now let’s get straight to the point and start writing the Commissioning File.
This is the basic structure of a commissioning file:
---
description: Elastic Filebeat reading MQTT Input

metadata:
  name: Filebeat

parameters:

definitions:

resources:
Code-Sprache: YAML (yaml)Add a Cybus::Container Resource for the filebeat to the resources section in the template. This will later allow you to run the Container when installing and enabling the Service, using the docker image from docker.elastic.co directly:
resources:
  filebeat:
    type: Cybus::Container
    properties:
      image: docker.elastic.co/beats/filebeat:7.13.2
      volumes:
        - /var/run/docker.sock:/var/run/docker.sock:ro
Code-Sprache: YAML (yaml)When starting the filebeat container, various variables must be configured correctly. In this example, these variables should not be integrated into a specialized container image. Instead, the variables should be configured “on the fly” when starting the standard container image from within Connectware, so that the entire configuration is stored in a single commissioning file. For this purpose, all configuration settings of the filebeat container are specified in the helper section of the commissioning file, defining a variable called CONFIG inside of the file’s definitions section:
definitions:
  CONFIG: !sub |
    filebeat.config:
      modules:
        path: /usr/share/filebeat/modules.d/*.yml
        reload.enabled: false

    filebeat.inputs:
    - type: mqtt
      hosts:
        - tcp://${Cybus::MqttHost}:${Cybus::MqttPort}
      username: admin
      password: admin
      client_id: ${Cybus::ServiceId}-filebeat
      qos: 0
      topics:
        - some/topic

    setup.ilm.enabled: false
    setup.template.name: "some_template"
    setup.template.pattern: "my-pattern-*"

    output.elasticsearch:
      index: "idx-%{+yyyy.MM.dd}-00001"

    cloud.id: "elastic:d2V***"
    cloud.auth: "ingest:Xbc***"
Code-Sprache: YAML (yaml)Now that the Filebeat configuration is set up, the container resource filebeat mentioned above needs to be extended in order to use this configuration on startup (in this and the following examples, the top-level headline resources: is skipped for brevity):
filebeat:
  type: Cybus::Container
  properties:
    image: docker.elastic.co/beats/filebeat:7.13.2
    entrypoint: [""]
    command:
      - "/bin/bash"
      - "-c"
      - !sub 'echo "${CONFIG}" > /tmp/filebeat.docker.yml && /usr/bin/tini -s -- /usr/local/bin/docker-entrypoint -c /tmp/filebeat.docker.yml -environment container'
    volumes:
      - /var/run/docker.sock:/var/run/docker.sock:ro
Code-Sprache: YAML (yaml)The filebeat container needs access credentials to set up the cloud connection correctly. Those credentials should not be written into the file as hard-coded values though. Credentials as hard-coded values should be avoided not only for security reasons, but also to make the commissioning file re-usable and re-configurable for many more service operators. To easily achieve this, we are going to use parameters.
In the parameters section we are creating two parameters of type string:
parameters:
  filebeat-cloud-id:
    type: string
    description: The cloud id string, for example elastic:d2V***

  filebeat-cloud-auth:
    type: string
    description: The cloud auth string, for example ingest:Xbc***
Code-Sprache: YAML (yaml)
These parameters are now ready to be used in our configuration. During the installation of the service, Connectware will ask us to provide the required values for these parameters.
To use the parameters in the configuration, the following lines in the Filebeat configuration (the CONFIG definition from above) need to be adapted:
  cloud.id: "${filebeat-cloud-id}"
  cloud.auth: "${filebeat-cloud-auth}"
Code-Sprache: YAML (yaml)The filebeat container is using access credentials not only for the cloud connection but also for the local input connection, which is the connection to the Connectware MQTT broker. Those access credentials have been set to the default credentials (admin/admin) in the definition above, which now need to be adapted to the actual non-default credentials. For your convenience, Connectware already has Global Parameters that are replaced by the current credentials of the MQTT broker. So the following lines in the Filebeat configuration (the CONFIG definition from above) need to be adapted, too:
  username: ${Cybus::MqttUser}
  password: ${Cybus::MqttPassword}
Code-Sprache: YAML (yaml)Finally the defaultRole for this service requires additional read permissions for all MQTT topics which the service should consume. To grant these additional privileges, another resource should be added:
resources:
  defaultRole:
    type: Cybus::Role
    properties:
      permissions:
        - resource: some/topic
          operation: read
          context: mqtt
Code-Sprache: YAML (yaml)In the end, the entire service commissioning file should look like this:
---
description: Elastic Filebeat reading MQTT Input

metadata:
  name: Filebeat

parameters:
  filebeat-cloud-id:
    type: string
    description: The cloud id string, for example elastic:d2V***

  filebeat-cloud-auth:
    type: string
    description: The cloud auth string, for example ingest:Xbc***

definitions:
  # Filebeat configuration
  CONFIG: !sub |
    filebeat.config:
      modules:
        path: /usr/share/filebeat/modules.d/*.yml
        reload.enabled: false

    filebeat.inputs:
    - type: mqtt
      hosts:
        - tcp://${Cybus::MqttHost}:${Cybus::MqttPort}
      username: ${Cybus::MqttUser}
      password: ${Cybus::MqttPassword}
      client_id: ${Cybus::ServiceId}-filebeat
      qos: 0
      topics:
        - some/topic

    setup.ilm.enabled: false
    setup.template.name: "some_template"
    setup.template.pattern: "my-pattern-*"

    output.elasticsearch:
      index: "idx-%{+yyyy.MM.dd}-00001"

    cloud.id: "${filebeat-cloud-id}"
    cloud.auth: "${filebeat-cloud-auth}"

resources:
  # The filebeat docker container
  filebeat:
    type: Cybus::Container
    properties:
      image: docker.elastic.co/beats/filebeat:7.13.1
      entrypoint: [""]
      command:
        - "/bin/bash"
        - "-c"
        - !sub 'echo "${CONFIG}" > /tmp/filebeat.docker.yml && /usr/bin/tini -- /usr/local/bin/docker-entrypoint -c /tmp/filebeat.docker.yml -environment container'
      volumes:
        - /var/run/docker.sock:/var/run/docker.sock:ro

  # Gaining privileges
  defaultRole:
    type: Cybus::Role
    properties:
      permissions:
        - resource: some/topic
          operation: read
          context: mqtt
Code-Sprache: YAML (yaml)
This commissioning file can now be installed and enabled, which will also start the filebeat container and set up its connections correctly. However, there is probably no input data available yet, but we will get back to this later. Depending on the input data, an additional structure should be prepared for useful content in Elasticsearch, which is described in the next section.
The first contact with the Elasticsearch cluster can be verified by sending some message to the topic to which the Filebeat MQTT inputs are subscribed (here: “some/topic”) and reviewing the resulting event in Kibana.
Once this is done, a service integrator may identify several elements of the created JSON document that need to be changed. The deployed Connectware service commissioning file allows us to ship incoming MQTT messages in configured topics to the Elasticsearch cluster as a JSON document with certain meta data that an operator may want to change to improve the data source information.
For example, a message sent using the service described above contains multiple fields with identical values, in this case agent.name, agent.hostname and host.name. This is due to the naming convention for container resources in a service commissioning files described in the Connectware Container Resource. As the ServiceId is “filebeat”, and the container resource is named “filebeat” too, the resulting container name, hostname and agent name in the transmitted search index documents are “filebeat-filebeat”, which looks as follows:
...
"fields": {
...
   "agent.name": [
     "filebeat-filebeat"
   ],
   "host.name": [
     "filebeat-filebeat"
   ],
...
   "agent.hostname": [
     "filebeat-filebeat"
   ],
...
Code-Sprache: YAML (yaml)
To get appropriate names in the search index for further evaluation and post processing, either change the serviceId and/or container resource name in the service commissioning file, or use Filebeat configuration options to set an alternative agent.name (by default is derived from the hostname, which is the container hostname created by Connectware). Be aware that the maximum number of characters for the clientId in Filebeat mqtt.input configuration is 23.
Change both the service name (serviceId) and the container resource name to identify the respective device as the data source, and redeploy the service commissioning file:
...
metadata:
  name: Shopfloor 1

...
resources:
  # The filebeat docker container
  filebeat_Machine_A_032:
...
Code-Sprache: YAML (yaml)
In addition to this, the Filebeat configuration can be modified slightly to set the agent.name appropriately along with some additional tags to identify our edge data sources and data shipper instance (is useful to group transactions sent by this single Beat):
...
definitions:
  CONFIG: !sub
...
   name: "shopfloor-1-mqttbeat"
   tags: [ "Cybus Connectware", "edge platform", "mqtt" ]
...
Code-Sprache: YAML (yaml)
This leads to improved field values in the search index, so that transactions can be better grouped in the search index, such as this:
...
"fields": {
...
   "agent.name": [
     "shopfloor-1-mqttbeat"
   ],
   "host.name": [
     "shopfloor-1-mqttbeat"
   ],
...
   "agent.hostname": [
     "shopfloor1-filebeat_Machine_A_032"
   ],
...
   "tags": [
     "Cybus Connectware",
     "edge platform",
     "mqtt"
   ],
...

Code-Sprache: YAML (yaml)Using Cybus Connectware offers extensive flexibility in mapping devices, configuring pre-processing rules and adding many different resources. It is up to the customer to define the requirements, so that a well-architected set of services can be derived for the Connectware instance.
To stream machine data collected by Connectware to Elasticsearch, existing MQTT topics can be subscribed by the Filebeat container. Alternatively, the Filebeat container can subscribe to MQTT topics that contain specific payload transformation. For instance, a normalized payload for an Elasticsearch index specifies an additional timestamp or specific data formats.
The advantage of using Connectware to transmit data to Elasticsearch is that it supports a lightweight rules engine to map data from different machines to Filebeat by just working with MQTT topics, for example:
resources:
  # mapping with enricher pattern for an additional timestamp
  machineDataMapping:
    type: Cybus::Mapping
    properties:
      mappings:
       - subscribe:
            topic: !sub '${Cybus::MqttRoot}/machineData/+field'
          rules:
            - transform:
                expression: |
                  (
                    $d := { $context.vars.field: value };
                    $merge(
                      [
                        $last(),
                        {
                          "coolantLevel": $d.`coolantLevel`,
                          "power-level": $d.`power-level`,
                          "spindleSpeed": $d.`spindleSpeed`,
                          "timestamp": timestamp
                        }
                      ]
                    )
                  )
          publish:
            topic: 'some/topic'

Code-Sprache: YAML (yaml)
A reasonable structural design of related Connectware service commissioning files depends on the number of machines to connect, their payload, complexity of transformation and the search index specifications in the Elasticsearch environment. See the Github project for a more advanced example concerning machine data transformation.
To explain these settings in detail, Cybus provides a complete Connectware documentation and Learn articles like Service Basics.
What has been added to the original Filebeat configuration is the typical task of a service operator connecting shopfloor devices and organizing respective resources in a Connectware service commissioning file. The service operator has further options to decompose this file to multiple files to optimize the deployment structure in this Low-code/No-code environment for their needs. Contact Cybus to learn more about good practices here.
Now that the data is transmitted to the Elasticsearch cluster, further processing is up to the search index users. The Elastic Stack ecosystem provides tools for working with search indices created from our data, such as simple full text search with Discovery, Kibana visualizations or anomaly detection and so on.
The message is transmitted as a message string and will be stored as a JSON document with automatically de-composed payload and associated metadata for the search index. A simple discovery of that continuously collected data shows something like this:
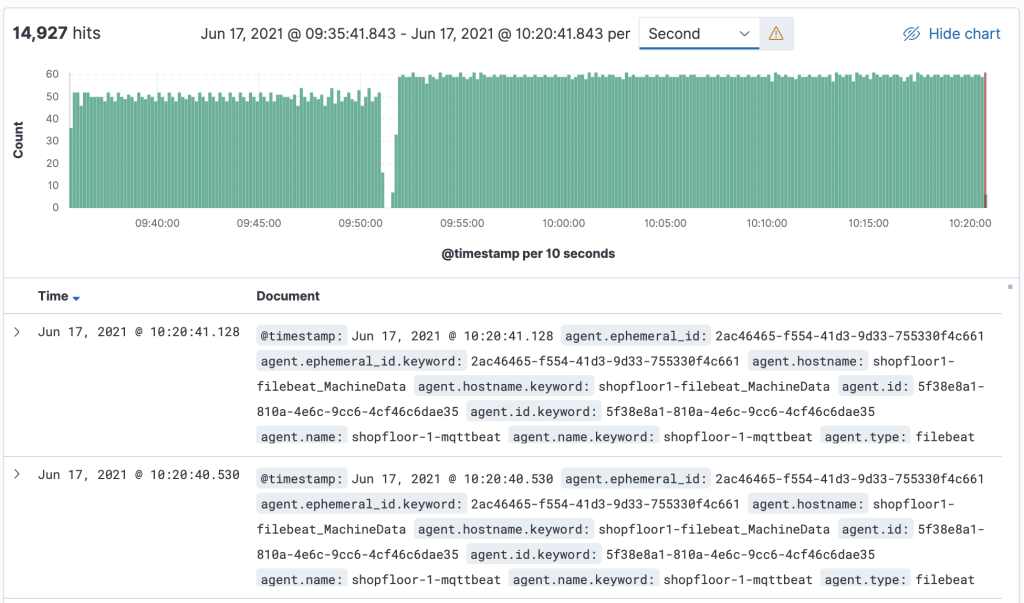
This lesson offered a brief introduction into the integration of Cybus Connectware with Elasticsearch using the Connectware built-in MQTT connector and the FileBeat with MQTT Input in a service commissioning file.
Additionally, Cybus provides sample service commissioning files and some other technical details in the Github project How to integrate Elasticsearch with Connectware.
As a next step, you can use Cybus Connectware to organize data ingestion from multiple machines for its further use with the Elastic Stack.
MQTT as an open network protocol and OPC UA as an industry standard for data exchange are the two most common players in the IIoT sphere. Often, MQTT (Message Queuing Telemetry Transport) is used to connect various applications and systems, while OPC UA (Open Platform Communications Unified Architecture) is used to connect machines. Additionally, there are also applications and systems that support OPC UA, just as there are machines or devices that support MQTT. Therefore, when it comes to providing communication between multiple machines/devices and applications that support different protocols, a couple of questions might arise. First, how to bridge the gap between the two protocols, and second, how to do it in an efficient, sustainable, secure and extensible way.
This article discusses the main aspects of MQTT and OPC UA and illustrates how these protocols can be combined for IIoT solutions. The information presented here would thus be useful for IIoT architects.
Both protocols are the most supported and most utilized in the IIoT. MQTT originated in the IT sphere and is supported by major IoT cloud providers, such as Azure, AWS, Google, but also by players specialized in industrial use cases, e.g. Adamos, Mindsphere, Bosch IoT, to name a few. The idea behind MQTT was to invent a very simple yet highly reliable protocol that can be used in various scenarios (for more information on MQTT, see MQTT Basics). OPC UA, on the contrary, was created by an industry consortium to boost interoperability between machines of different manufacturers. As MQTT, this protocol covers core aspects of security (authentication, authorization and encryption of the data) and, besides, meets all essential industrial security standards.
IIoT use cases are complex, because they bring together two distinct environments – Information Technology (IT) and Operational Technology (OT). Traditionally, the IT and OT worlds were separated from each other, had different needs and thus developed very different practices. One of such dissimilarities is the dependence on different communication protocols. The IT world is primarily influenced by higher level applications, web technology and server infrastructure, so the adoption of MQTT as an alternative to HTTP is on the rise there. At the same time, in the OT world, OPC UA is the preferable choice due to its ability of providing a perfectly described interface to industrial equipment.
Today, however, the IT and OT worlds gradually converge as the machine data generated on the shopfloor (OT) is needed for IIoT use cases such as predictive maintenance or optimization services that run in specialized IT applications and often in the cloud. Companies can therefore benefit from combining elements from both fields. For example, speaking of communication protocols, they can use MQTT and OPC UA along with each other. A company can choose what suits well for its use case’s endpoint and then bridge the protocols accordingly. If used properly, the combination of both protocols ensures greatest performance and flexibility.
As already mentioned above, applications usually rely on MQTT and machines on OPC UA. However, it is not always that straightforward. Equipment may also speak MQTT and MES systems may support OPC UA. Some equipment and systems may even support both protocols. On top of that, there are also numerous other protocols apart from MQTT and OPC UA. All this adds more dimensions to the challenge of using data in the factory.
This IIoT challenge can, however, be solved with the help of middleware. The middleware closes the gap between the IT and OT levels, it enables and optimises their interaction. The Cybus Connectware is such a middleware.
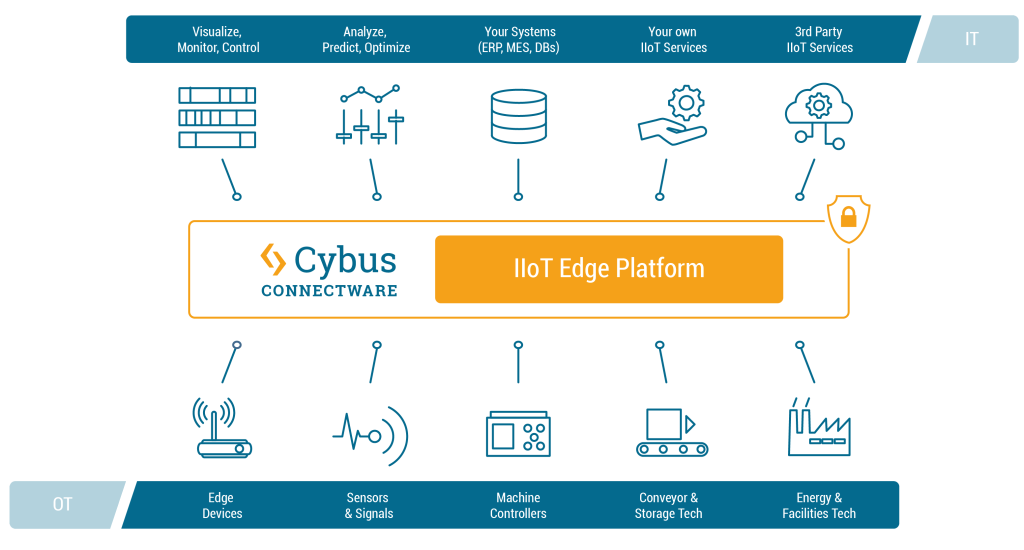
The Cybus Connectware supports a broad variety of protocols – including MQTT and OPC UA – and thus makes it possible to connect nearly any sort of IT application with nearly any sort of OT equipment. In the case of OPC UA and MQTT, the bridging of two protocols is achieved through connecting four parties: OPC UA Client, OPC UA Server, MQTT Client and MQTT Broker. The graphic below illustrates how the Cybus Connectware incorporates these four parties.
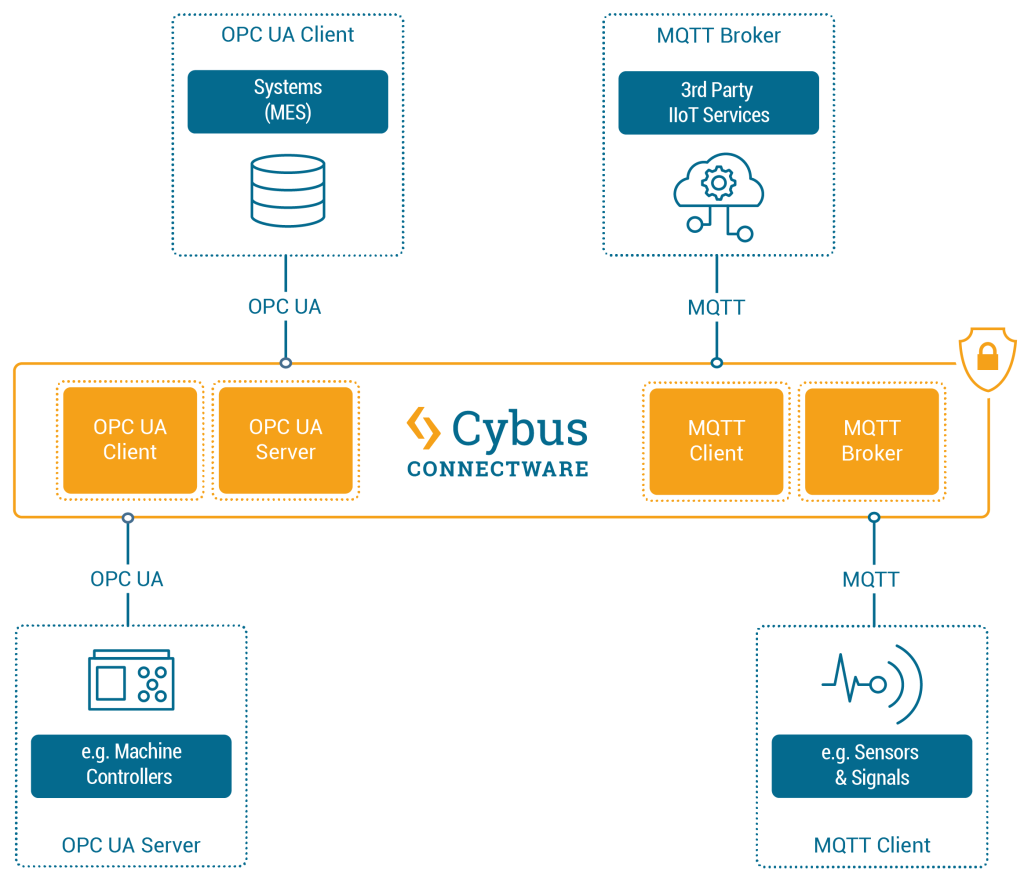
On the machines layer, different equipment can be connected to Connectware. For example, if a device such as a CNC controller (e.g. Siemens SINUMERIK) that uses OPC UA should be connected, then Connectware will serve as the OPC UA Client and the controller as the OPC UA Server. While connecting a device that supports MQTT (e.g. a retrofit sensor), Connectware will act as the MQTT broker, and the sensor will be the MQTT client.
Likewise, various applications can be connected to Connectware on the applications layer. In case of connecting services that support MQTT (e.g. Azure IoT Hub or AWS IoT / Greengrass), Connectware will act as the MQTT client, while those services will act as MQTT brokers. If connecting systems that support OPC UA (e.g. MES), Connectware will play the role of the OPC UA Server, while the systems will act as OPC UA clients.
The question may arise as to why not connect applications or systems that support a specific protocol directly to devices that support the same protocol, e.g. a SINUMERIK machine controller to a MES (which both “speak” OPC UA), or a retrofit sensor to the Azure IoT Hub (which both can communicate via MQTT)? Although this is theoretically possible, in practice it comes with fundamental disadvantages that can quickly become costly problems. A tightly coupled system like this requires far more effort as well as in depth protocol and programming skills. Such a system is then cumbersome to administer and not scalable. Most importantly, it lacks agility when introducing changes such as adding new data sources, services or applications. Thus a “pragmatic” 1:1 connectivity approach actually slows down the IIoT responsibles’ ability for business enablement where it is really needed to accelerate.
At this point, it is worth moving from the very detailed example of MQTT and OPC UA to a broader picture, because IIoT is a topic full of diversity and dynamics.
In contrast to the 1:1 connectivity approach, the Connectware IIoT Edge Platform enables (m)any-to-(m)any connectivity between pretty much any OT and IT data endpoints. From a strategic point of view, Connectware, acting as a “technology-neutral layer”, provides limitless compatibility in the IIoT ecosystem while maintaining convenient independence from powerful providers and platforms. It provides a unified, standardised and systematic environment that is made to fit expert users’ preferences. On this basis, IIoT responsibles can leverage key tactical benefits such as data governance, workflow automation and advanced security. You can read more about these aspects and dive into more operational capabilities in related articles.
This lesson will explain how to connect and use an MQTT client utilizing Cybus Connectware. To understand the basic concepts of Connectware, check out the Technical Overview lesson. To follow along with the example, you will also need a running instance of Connectware. If you don’t have that, learn Installing Connectware. And finally this article is all about communication with MQTT clients. So unlikely but if you came here without ever having heard about MQTT, head over to our MQTT Basics lesson.
This article will teach you the integration of MQTT clients. In more detail, the following topics are covered:
In this lesson we will utilize a couple of MQTT clients, each fulfilling a different purpose and therefore all having their right to exist.
Mosquitto is an open source message broker which also comes with some handy client utilities. Once installed on your system it provides the mosquitto_pub and mosquitto_sub command line MQTT clients which you can use to perform testing or troubleshooting, carried out manually or scripted.
MQTT Explorer is an open-source MQTT client that provides a graphical user interface to communicate with MQTT brokers. It offers convenient ways of configuring and establishing connections, creating subscriptions or publishing on topics. The program presents all data clearly and in well organized sections but also enables the user to select which data should appear on the monitor, should be hid or dumped in a file. Additionally it provides tools to decode the payload of messages, execute scripts or track the broker status.
The Workbench is part of the Cybus Connectware. It is a flow-based, visual programming tool running a Node-RED instance to create data flows and data pre-processing on level of Connectware. One way to access data on Connectware utilizing the Workbench is via MQTT. The Workbench provides publish and subscribe nodes which serve as data sources or sinks in the modeled data flow and allows users to build applications for prototyping or debugging. But it is capable of a lot of more useful functions and nodes, for instance creating dashboards.
To connect users to Connectware, they need credentials for authorization. There are two ways to create credentials:

read, write, or readWrite permissions. These are equivalent to subscribe, publish, or subscribe and publish. In the Users and Roles list, click the user for which you want to add permissions.clients/#. This gives the selected user access to the clients topic. The wildcard # gives access to any topic that is hierarchically below clients. For example, clients/status/active.The second way of creating credentials for a user is the client registry process (also referred to as self registration). There are two variants of this process: The implicit form works with any MQTT client while the explicit form is for clients that use the REST API. In this lesson we will only look at the implicit variant. If you want to learn more on self registration and both of its forms, please consult the Reference docs.
We will now step through the process of implicit client registration. At first we need to activate the self registration: In the Connectware Admin UI navigate to User > Client Registry and click Unlock. This will temporarily unlock the self registration for clients. The next step is that the client tries to connect to Connectware with a username that does not yet exist.
We utilize the mosquitto_sub client for this which is especially easy because we just need to use the command mosquitto_sub -h localhost -p 1883 -u Mosquitto -P 123456 -t clients assuming we are running Connectware on our local machine and want to register the user Mosquitto with the password 123456 (you should of course choose a secure password). The topic we chose using option -t is not relevant, this option is just required for issuing the command. We will explain this command in detail in the section about subscribing data.
Shortly after we have issued this command and it exited with the message „Connection error: Connection Refused: not authorized.“ we can look at the Client Registry in the Admin UI and see the connection attempt of our Mosquitto client.
Clicking an entry in the list opens the Grant Access dialog. This summarizes the details of the request and the permissions requested. You can only request permissions using the explicit method. To grant access to this client and create a user, click Allow.
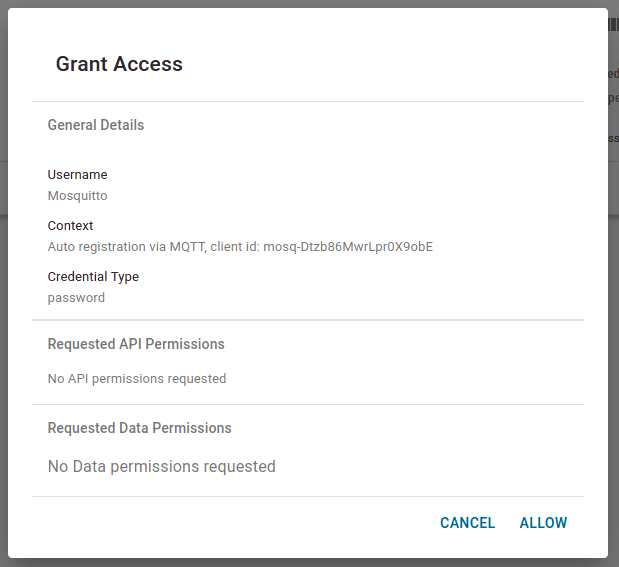
On the navigation bar, click User to see the newly created user „Mosquitto“. Since we are using the implicit method we now need to manually add permissions to the accessible topics as we did before.
We are now ready to connect our clients to Connectware via MQTT.
We already made use of the client functions of Mosquitto by utilizing it for our self registration example. That also suggested that we do not explicitly need to establish a connection before subscribing or publishing, this process is included in the mosquitto_sub and mosquitto_pub commands and we supply the credentials while issuing.
Using MQTT Explorer, we need to configure the connection.
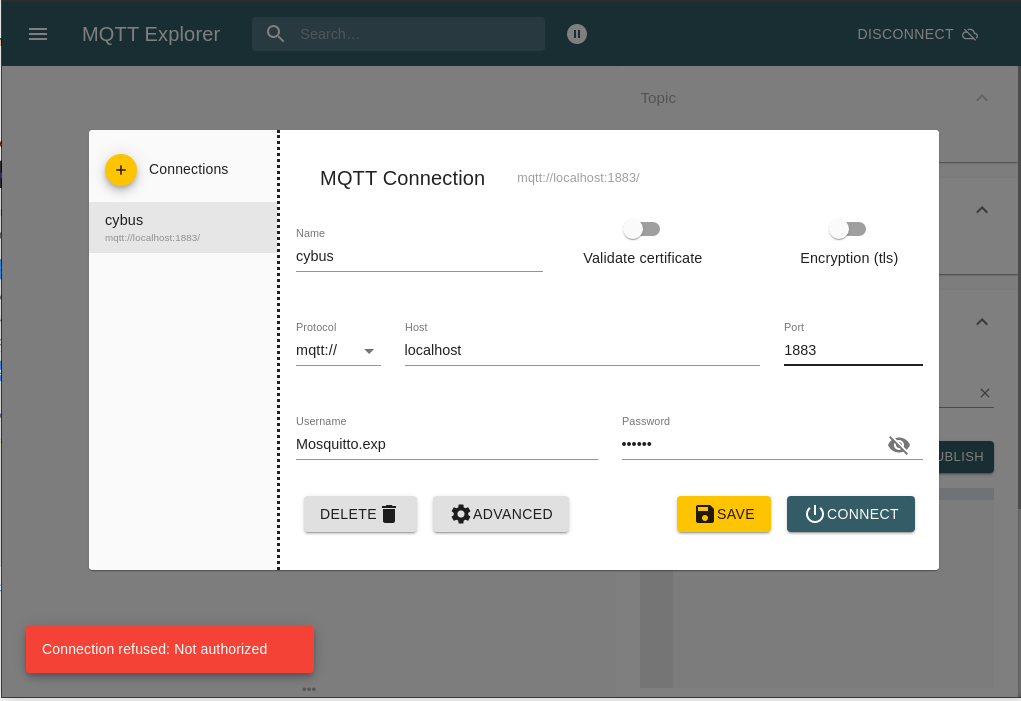
First we create a new connection by clicking the plus (+) in the top left corner. We name the new profile „cybus“ and define the host as „localhost“ (exchange this with the address you are running your Connectware on). Then fill out the user credentials. All other settings can remain default for this example. We also need to perform client registry since it is another client otherwise we get an error as show at the bottom left corner.
The Workbench can be accessed through the Admin UI by clicking Workbench in the navigation bar. A new tab will open showing the most recent edited flow of our Workbench. If it is empty you can use this otherwise click the (+) button to the upper right of the actual shown flow. If you are new to the Workbench, we won’t go into details about the functions and concepts in this lesson but it will demonstrate the most simple way of monitoring data with it.
Take a look at the left bar: There you see the inventory of available nodes. Scrolling down you will find the section network containing two MQTT nodes among others. The so-called mqtt in and mqtt out nodes represent the subscribe and publish operations. Drag the mqtt out node and drop it on your flow, double-clicking it will show you its properties. The drop-down-menu of the Server property will allow you to add a new mqtt broker by clicking the pencil symbol next to it.
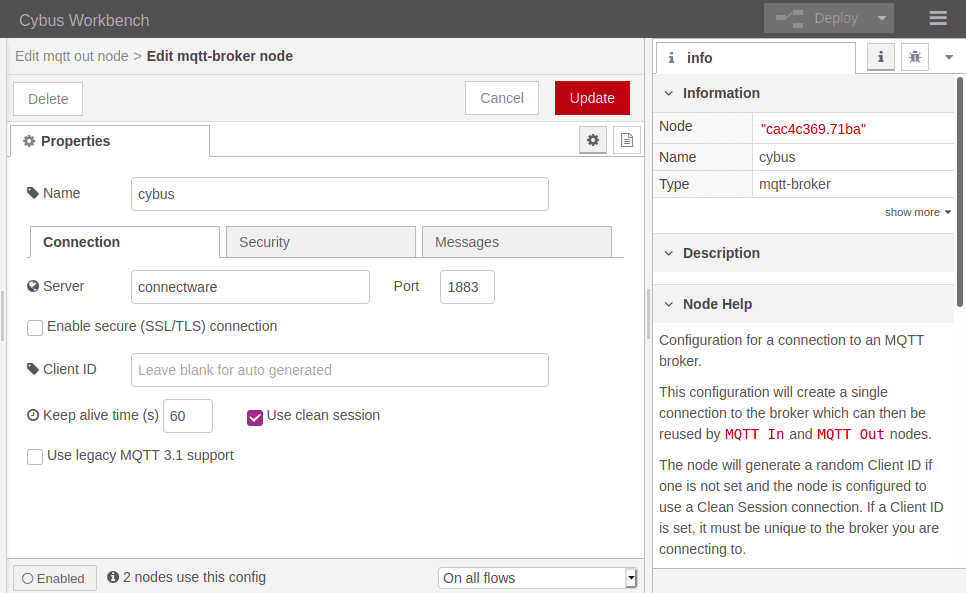
We name this new connection „cybus“ and define the server address as connectware. This is the way to address the local running Connectware, you won’t be able to access it using localhost! Now switch to the Security tab and fill in username and password. Save your changes by clicking Add in the upper right corner. Make sure the just created configuration is active for the Server property. For the property Topic we choose the topic we selected for our clients: clients/workbench. The other properties will keep their default settings. Click Done in the upper right corner.
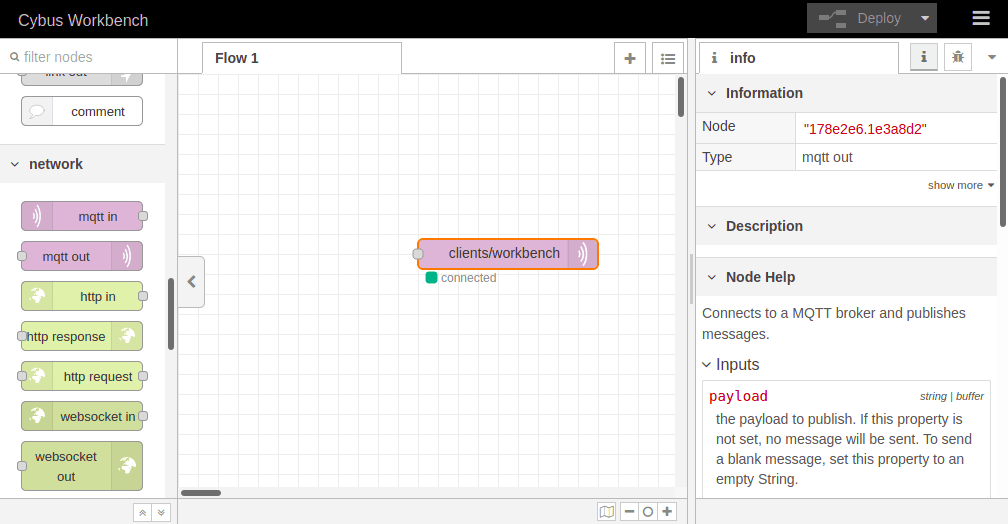
To apply the changes we just made click the button Deploy in the upper right corner. This will reset our flow and start it with the latest settings. You will now see that the MQTT node is displayed as „connected“, assuming everything was configured correctly. We successfully established a connection between the Workbench and our Connectware.
Publishing data allows us to make it available. It does not necessarily mean that someone is actually receiving it but anyone with the permission to subscribe on the concerning topic could.
Using Mosquitto publishing data can be achieved by a single command line utilizing mosquitto_pub. For this example we want to connect to Connectware using the following options:
-h localhost-p 1883-u Mosquitto-P 123456-t clients/mosquitto-m "Hello World"mosquitto_pub -h localhost -p 1883 -u Mosquitto -P 123456 -t clients/mosquitto -m "Hello World"
If successful the command will complete without any feedback message. We could not confirm yet if our message arrived where we expected it. But we will validate this later when coming to subscribing data.
Publishing with MQTT.fx is even simpler once the connection is configured and a connection is established (indicated by the gray/green circle in the upper right corner). If the indicator shows green, we are connected and ready to shoot some messages.
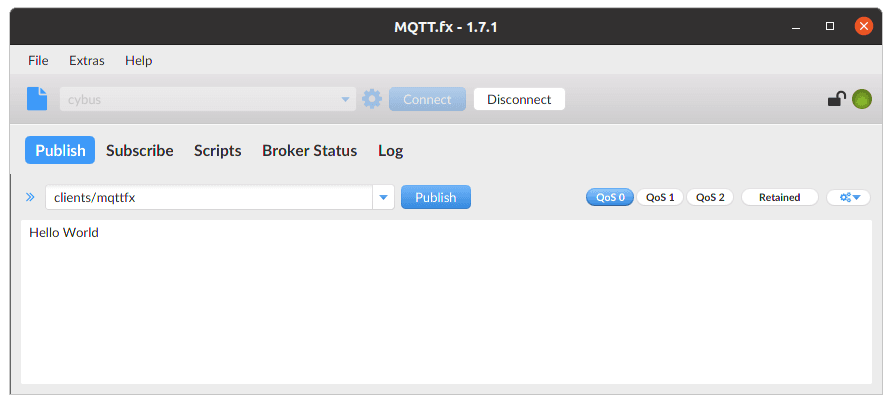
Switch to the Publish section. In the input line next to the Publish-button you define the topic you want to publish to. We will go for the topic clients/mqttfx. Then you click the big, blank box below and type a message, e.g. „Hello World“. To publish this message click Publish.
Again we have no feedback if our message arrived but we will take care of this in the Subscribing data section.
We already added a publishing node to our flow when we established a connection to Connectware and configured it to publish on clients/workbench. Having this set the Workbench is ready to publish but the messages are still missing.
At this point we want to create a data source in our flow which periodically publishes data through the mqtt out node. We simply drag an inject node from the nodes bar into our flow and drop it left to the mqtt out node. Now we can draw a connection from the small gray socket of one to the other node.
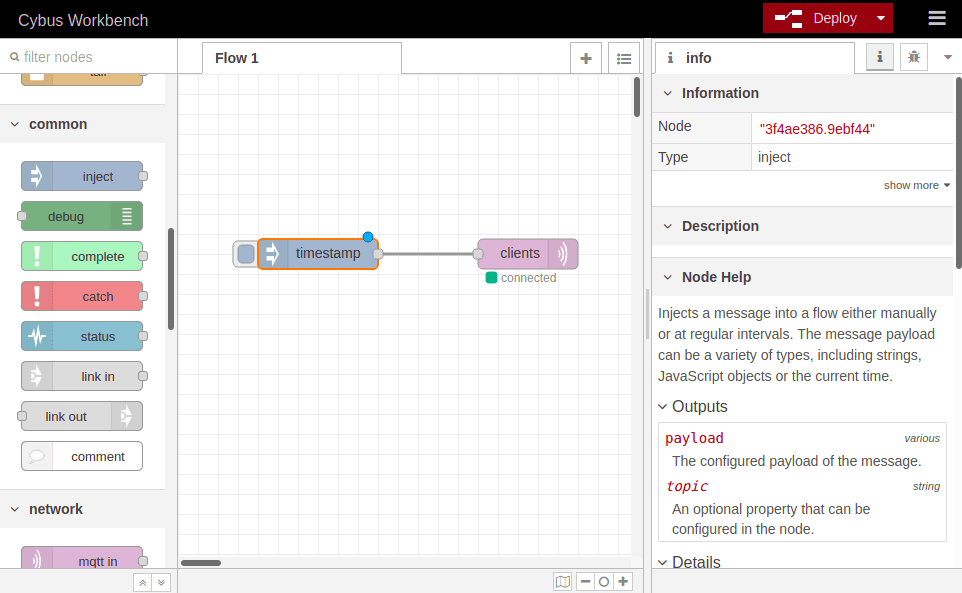
Double-clicking the inject node, which is now labeled „timestamp“, shows its properties. We can define the payload, but we will keep „timestamp“, declare a topic to publish to, which we leave blank because we defined the topic in out MQTT node, and we can set if and how often repeated the message should be injected in our flow. If we do not define repeating a message will be injected only if we click the button on the left of the inject node in our flow.
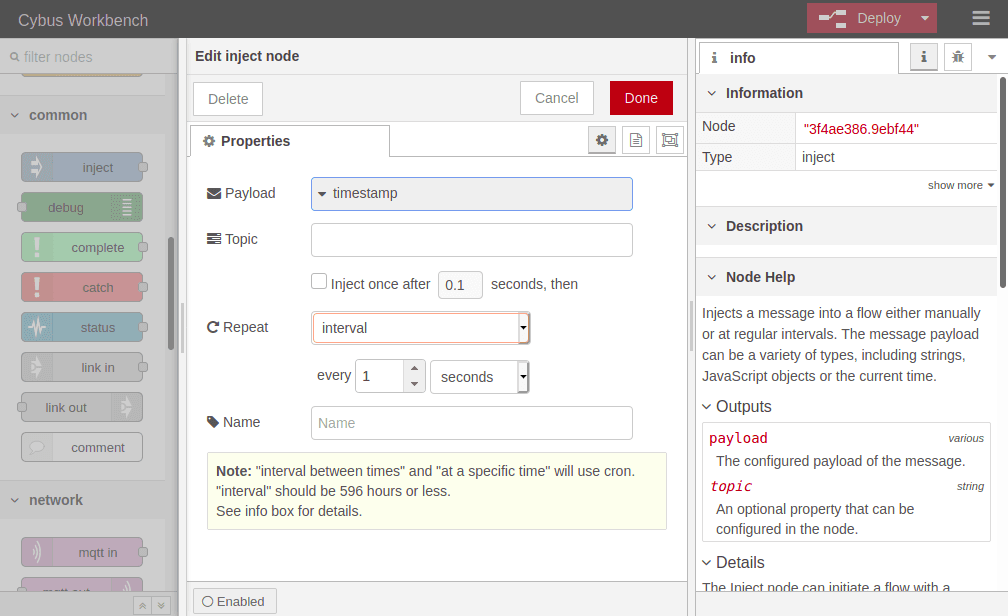
We set repeating to an „interval“ of every second and confirm the settings by clicking Done in the upper right corner. Now we have to Deploy again to apply our changes. We still have no confirmation that everything works out but we are confident enough to go on and finally subscribe to the data we are generating.
Subscribing data means that the client will be provided with new data by the broker as soon as it is available. Still we do not have a direct connection to the publisher, the broker is managing the data flow.
We already used mosquitto_sub to self register our client as a user. We could have also used mosquitto_pub for this but now we want to make use of the original purpose of mosquitto_sub: Subscribing to an MQTT broker. Not any broker but the broker of our Connectware.
We are using the following options:
-h localhost-p 1883-u Mosquitto-P 123456-t clients/workbenchmosquitto_sub -h localhost -p 1883 -u Mosquitto -P 123456 -t clients/workbench
Again make sure that you have specified the address of your Connectware as host which does not necessarily have to be your local machine! We will subscribe to the topic clients/workbench where we are publishing the messages from our Workbench.

And Tada! The mosquitto client now shows us every new message published on this topic – in this case the timestamps generated by our Workbench.
Already having the connection to our Connectware established it is a piece of cake to subscribe to a topic. On the left side under localhost, we can see the messages coming:
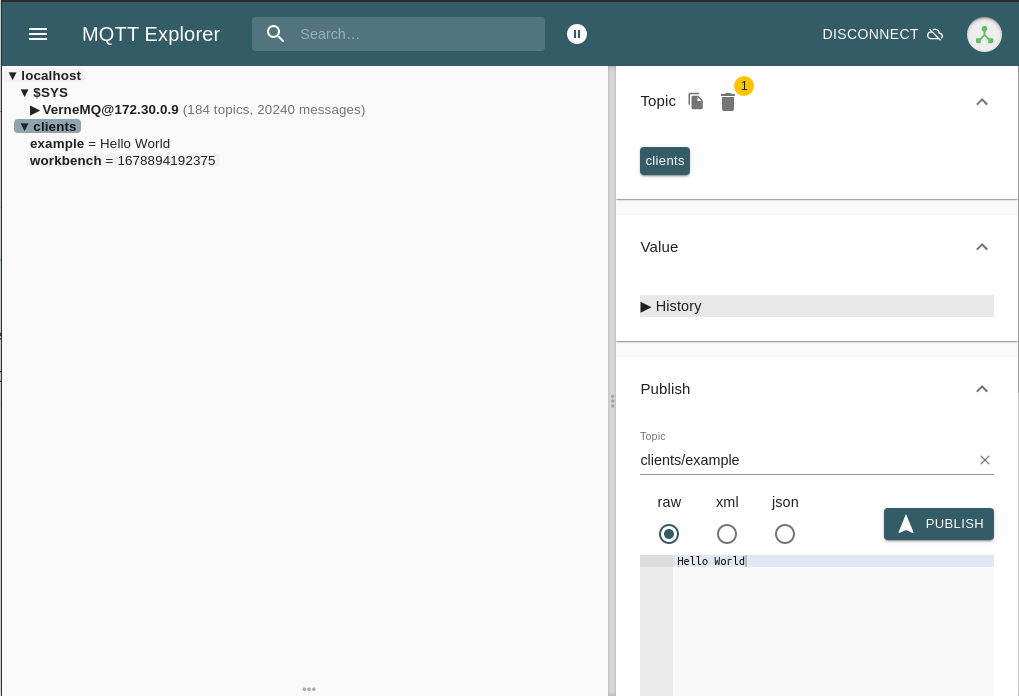
And there you see finely presented all the data flying in. You can also add more topics to be monitored simultaneously and manage which should be presented to you or be dumped in a file.
Eventually we will utilize the Workbench to monitor our data. But why just monitor it? The Workbench has a lot more to offer and exploring it will quickly give you a hint which possibilities lie ahead. But we will focus on that in another lesson.
At first we add an mqtt in node to the flow where we already created the data generator. Double-clicking it we choose the previously configured server „cybus“ and the topic clients/#. The wildcard # defines, that we subscribe to every topic under clients. Be careful using wildcards since you could accidentally subscribe to a lot of topics which could possibly cause very much traffic and a message output throwing data from all the topics in a muddle. Confirm the node properties by clicking Done and add a debug node to the flow. Draw a connection from the mqtt in to the debug node and Deploy the flow.
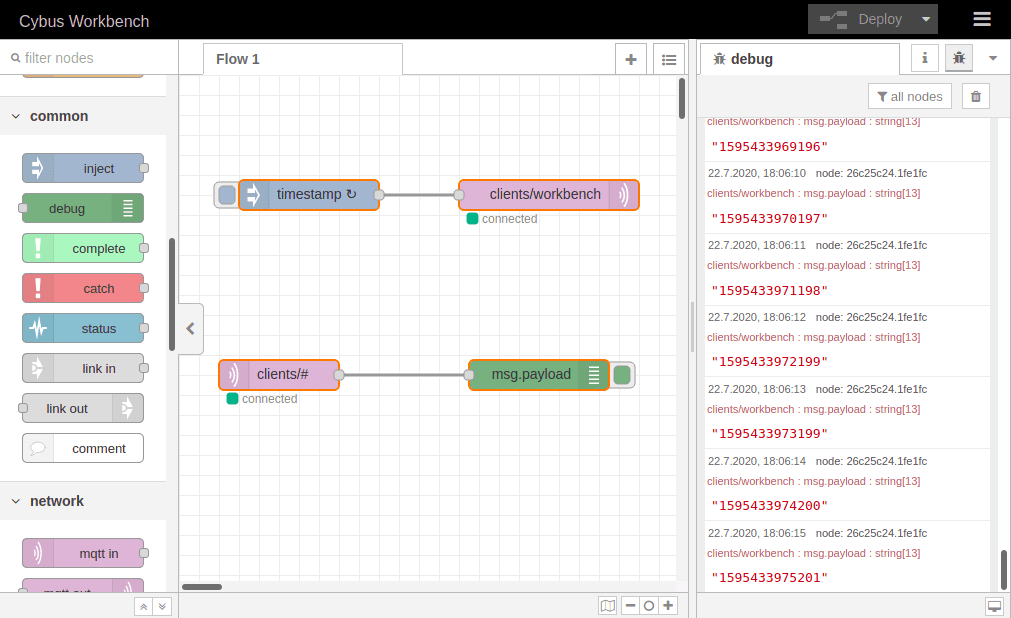
Click the bug symbol in the upper right corner of the information bar on the right. We see there are already messages coming in: They are the timestamp messages created in the very same flow but taking a detour via the MQTT broker before plopping in our debug window. They are messing up the show so let us just cut the connection between the „timestamp“ node and the publish node by selecting the connection line and pressing Del and Deploy the flow one more time.
Now that we have restored the quiet, let us finally validate if publishing with mosquitto_pub and MQTT.fx even works out. So issue the mosquitto_pub command again and also open MQTT.fx and publish a message like we did in the section before.
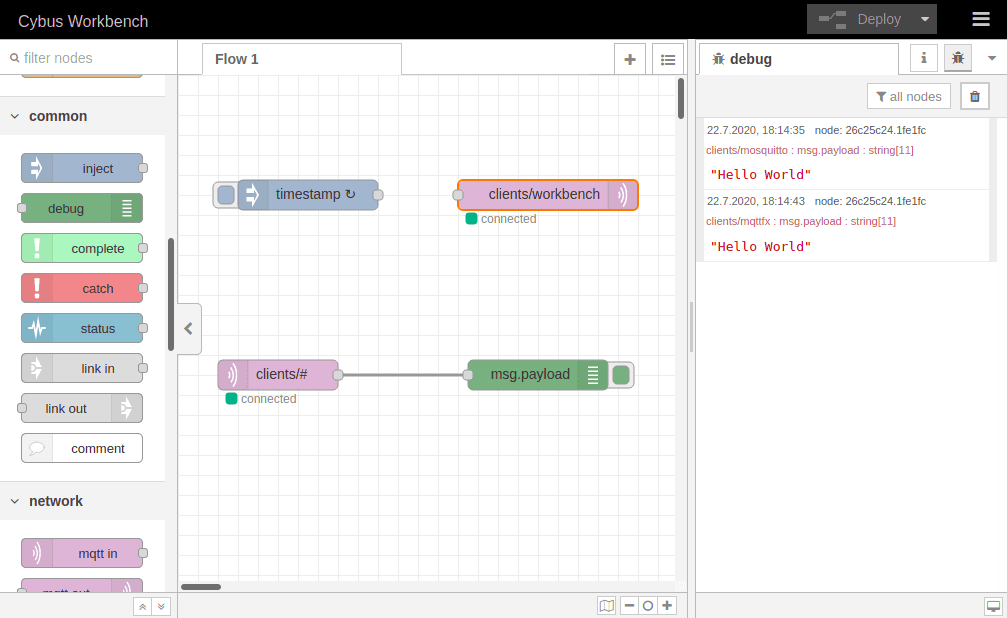
Et voilà! We can see two „Hello World“ messages in our debug window and looking at the topics they were published on (written small in red right above the message text) we learn that one came from Mosquitto and the other from MQTT.fx.
This was quite a journey! We started in the realms of Connectware, created credentials and permissions, learned about the magic of self registration and the trinity of MQTT clients. We went on and established connections between clients and brokers and sent messages to unobserved topics, struggling with the uncertainty of whether their destinations will ever be reached. But we saw light when we discovered the art of subscribing and realized that our troubles had not been in vain. In the end we received the relieving and liberating call of programmers: „Hello World“!
Connectware offers powerful features to build and deploy applications for gathering, filtering, forwarding, monitoring, displaying, buffering, and all kinds of processing data… why not build a dashboard for instance? For guides check out more of Cybus Learn.
We assume that you are familiar with the following topics:
This lesson goes through the required steps to connect and use your Siemens SIMATIC S7 device with Cybus Connectware. Following this tutorial will enable you to connect and use your own SIMATIC S7 device on Connectware with ease!
The SIMATIC S7 is a product line of PLCs by Siemens that are widely used in industrial automation. The S7 is capable of connecting several sensors and actuators through digital or analog IOs which can be modularly extended.
Reading and writing data on the PLC can be realized through the S7 communication services based on ISO-on-TCP (RFC1006). In this case the PLC acts as a server allowing communication partners to access PLC data without the need of projecting the incoming connections during PLC programming. We will use this feature to access the S7 from Connectware.
To follow this lesson you need to have a computer, a running Cybus Connectware instance and one of the following:
A Siemens S7 PLC and access to STEP7 (TIA Portal)
Conpot PLC Emulator
You can download the service commissioning file that we use in this example from the Cybus GitHub repository.
The YAML based Commissioning File tells Cybus Connectware the type of device to be connected, its connection configuration and it specifies the endpoints that should be accessed. Commissioning File details can be found in the Reference docs. For now let’s focus on the three main resources in the file, which are:
In the following chapters we will go through the three resources and create an example Commissioning File in which we connect to an S7 device and enable read/write access to a data endpoint.
Inside of the resource section of the commissioning file we define a connection to the device we want to use. All the information needed for Connectware to talk to the device is specified here. This information for example includes the protocol to be used, the IP address and so on. Our connection resource could look like the following:
# ----------------------------------------------------------------------------#
# Connection Resource - S7 Protocol
# ----------------------------------------------------------------------------#
s7Connection:
  type: Cybus::Connection
  properties:
    protocol: S7
    connection:
      host: 192.168.10.60
      port: 102
      rack: 0
      slot: 1
      pollInterval: 1000
Code-Sprache: YAML (yaml)
We define that we want to use the Cybus::Connection resource type, which tells Connectware that we want to create a new device connection. To define what kind of connection we want to use, we are specifying the S7 protocol. In order to be able to establish a connection to the device, we need to specify the connection settings as well. Here, we want to connect to our S7 device on the given host IP, port, rack and slot number.
Furthermore, we specified that the pollIntervall for reading the data will be set to one second.
We want to access certain data elements on the PLC to either read data from or write data to the device. Similar to the Connection section of the commissioning file, we define an Endpoint section:
# ----------------------------------------------------------------------------#
# Endpoint Resource - S7 Protocol
# ----------------------------------------------------------------------------#
s7EndpointDB1000:
  type: Cybus::Endpoint
  properties:
    protocol: S7
    connection: !ref s7Connection
    subscribe:
      address: DB10,X0.0
Code-Sprache: YAML (yaml)
We define a specific endpoint, which represents any data element on the device, by using the Cybus::Endpoint resource. Equally to what we have done in the connection section, we have to define the protocol this endpoint is relying on, namely the S7 protocol. Every endpoint needs a connection it belongs to, so we add a reference to the earlier created connection by using !ref followed by the name of the connection resource. Finally, we need to define which access operation we would like to perform on the data element and on which absolute address in memory it is stored at. In this case subscribe is used, which will read the data from the device in the interval defined by the referenced connection resource.
The data element which is to be accessed here is located on data block 10 (DB10) and is a single boolean (X) located on byte 0, bit 0 (0.0). If you wish to learn more on how addressing works for the S7 protocol please refer to our documentation here.
Now that we can access our data-points on the S7 device we want to map them to a meaningful MQTT topic. Therefore we will use the mapping resource. Here is an example:
# ----------------------------------------------------------------------------#
# Mapping Resource - S7 Protocol
# ----------------------------------------------------------------------------#
mapping:
  type: Cybus::Mapping
  properties:
    mappings:
      - subscribe:
          endpoint: !ref s7EndpointDB1000
        publish:
          topic: !sub '${Cybus::MqttRoot}/DB1000'
Code-Sprache: YAML (yaml)
Our mapping example transfers the data from the endpoint to a specified MQTT topic. It is very important to define from what source we want the data to be transferred and to what target. The source is defined by using subscribe and setting endpoint to reference the endpoint mentioned above. The target is defined by using publish and setting the topic to the MQTT topic where we want the data to be published on. Similarly to using !ref in our endpoint, here we use !sub which substitutes the variable within ${} with its corresponding string value.
Adding up the three previous sections, a full commissioning file would look like this:
description: >
  S7 Example

metadata:
  name: S7 Device

resources:
# ----------------------------------------------------------------------------#
# Connection Resource - S7 Protocol
# ----------------------------------------------------------------------------#
  s7Connection:
    type: Cybus::Connection
    properties:
      protocol: S7
      connection:
        host: 192.168.10.60
        port: 102
        rack: 0
        slot: 1
        pollInterval: 1000

# ----------------------------------------------------------------------------#
# Endpoint Resource - S7 Protocol
# ----------------------------------------------------------------------------#
  s7EndpointDB1000:
    type: Cybus::Endpoint
    properties:
      protocol: S7
      connection: !ref s7Connection
      subscribe:
        address: DB10,X0.0

# ----------------------------------------------------------------------------#
# Mapping Resource - S7 Protocol
# ----------------------------------------------------------------------------#
  mapping:
    type: Cybus::Mapping
    properties:
      mappings:
        - subscribe:
            endpoint: !ref s7EndpointDB1000
          publish:
            topic: !sub '${Cybus::MqttRoot}/DB1000'
Code-Sprache: YAML (yaml)Usually we also want to write data to the device. This can easily be accomplished by defining another endpoint where we use write instead of subscribe.
s7EndpointDB1000Write:
  type: Cybus::Endpoint
  properties:
    protocol: S7
    connection: !ref s7Connection
    write:
      address: DB10,X0.0
Code-Sprache: YAML (yaml)
We also append our mappings to transfer any data from a specific topic to the endpoint we just defined.
mapping:
  type: Cybus::Mapping
  properties:
    mappings:
      - subscribe:
          endpoint: !ref s7EndpointDB1000
        publish:
          topic: !sub '${Cybus::MqttRoot}/DB1000'
      - subscribe:
          topic: !sub '${Cybus::MqttRoot}/DB1000/set'
        publish:
          endpoint: !ref s7EndpointDB1000Write
Code-Sprache: YAML (yaml)
To actually write a value, we just have to publish it on the given topic. In our case the topic would be services/s7device/DB1000/set and the message has to look like this:
{
  "value": true
}
Code-Sprache: YAML (yaml)We are finally ready to connect to our Siemens S7 PLC and use it.

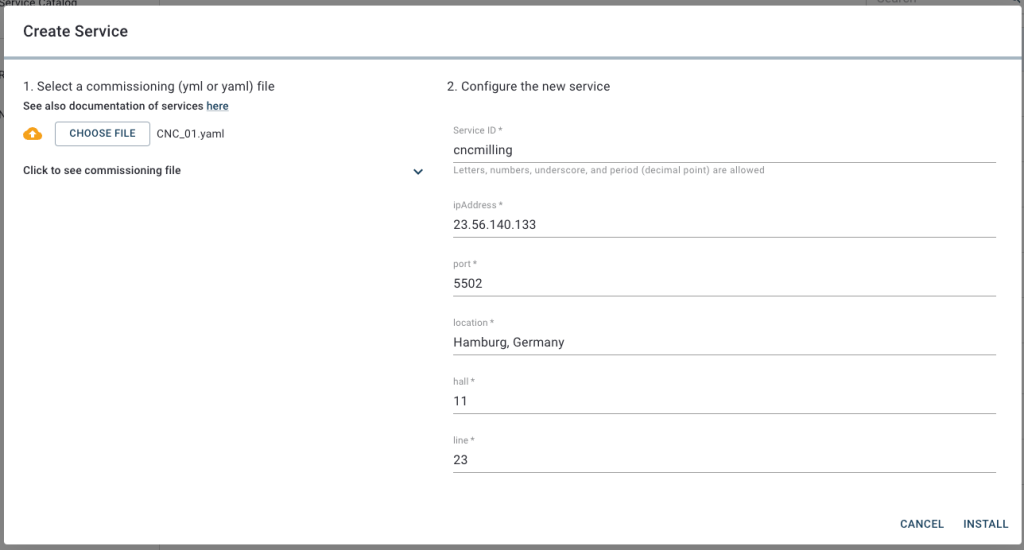

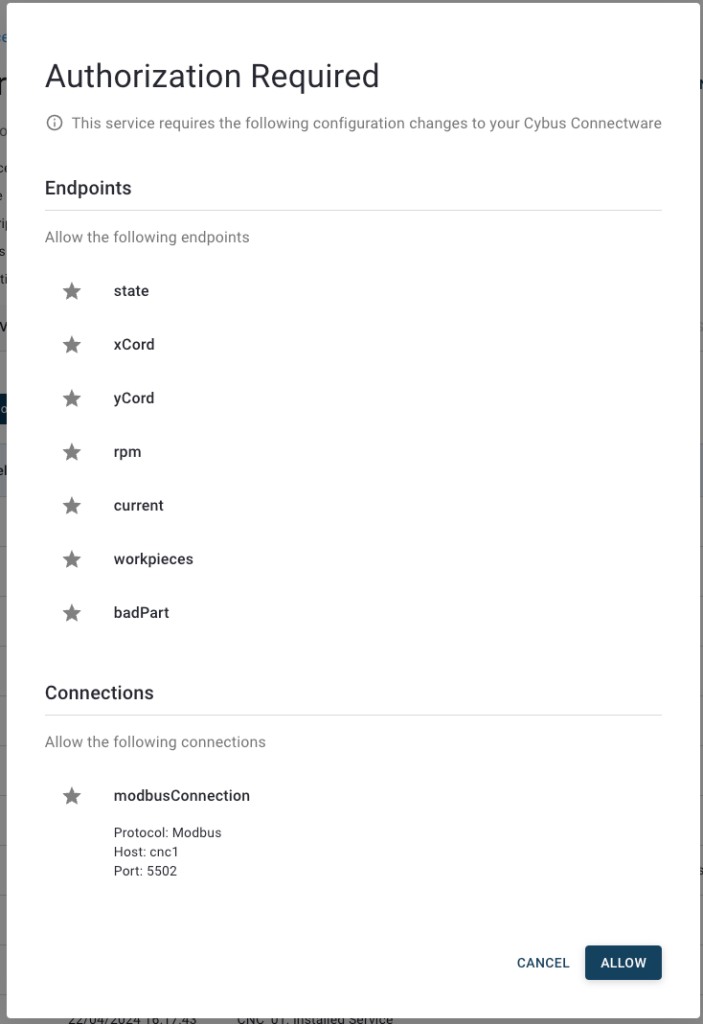
In this Cybus Learn article we learned how to connect and use an S7 device on Connectware. See Example Project Repo for the complete Commissioning File. If you want to keep going and get started with connecting your own S7 device with custom addressing, please visit the Reference docs to get to know all the Connectware S7 protocol features.
A good point to go further from here is the Service Basics Lesson, which covers how to use data from your S7 device.
Disclaimer:
Step7, TIA Portal, S7, S7-1200, Sinamics are trademarks of Siemens AG
This guide is to help you connect to an OPC UA server, using Connectware. It assumes that you understand the fundamental Connectware concepts. For that you can check out the Technical Overview. To follow the example, you should have a Connectware instance running. If you don’t have that, learn Installing Cybus Connectware. Although we focus on OPC UA here, you should also be familiar with MQTT. If in doubt, head over to MQTT Basics.
You will learn to integrate OPC UA servers into your Connectware use case. Everything you need to get started will be covered in the following topics:
Service YAMLs used in this lesson are available on GitHub.
Our example utilizes the OPC UA server at opcuaserver.com, because it is publicly available. You can of course bring your own device instead.
This guide recommends using FreeOpcUa’s Simple OPC UA GUI client for exploration. It is open source and offers convenient installation on Windows, Linux and Mac. If you prefer working on the terminal, go for Etienne Rossignon’s opcua-commander. If you have another option available, you may as well stick to it.
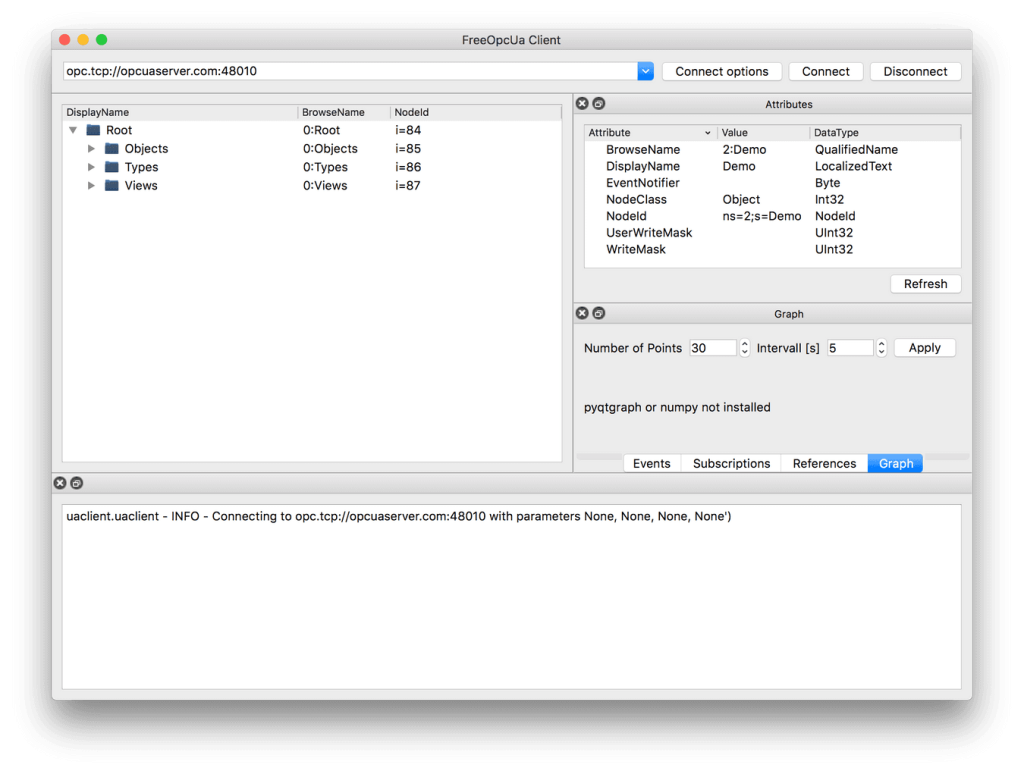
Let’s get started! Launch your OPC UA browser and connect to the endpoint opc.tcp://opcuaserver.com:48010 (or whatever endpoint applies to the device you brought). Tada! – the three root nodes Objects, Types, and Views should show up.
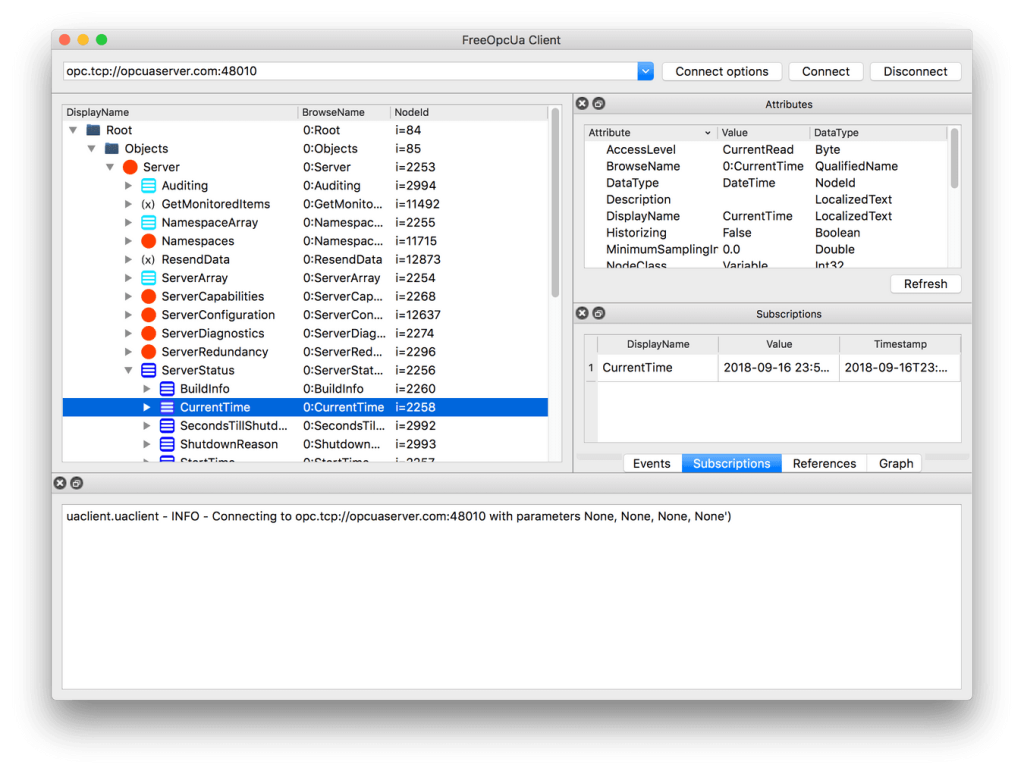
Explore and find the node which is displayed as CurrentTime. Select it and take a look at the Attributes pane – according to the NodeClass attribute we are dealing with a Variable which, by specification, contains a Value attribute. Variable nodes allow us to read and write data, depending on the AccessLevel attribute.
Right click on CurrentTime and select subscribe to data change. The Subscriptions pane then shows the actual value and it is updating at a fast rate.
Now we know that Variable nodes in the OPC UA address space are the datasources, but how to make use of them with Connectware? There are two ways to reference them:
NodeId, which is a node’s unique identifier. For example, the CurrentTime variable’s NodeId is i=2258.BrowsePath, which is the path of BrowseName when you navigate the treeview. For example, the CurrentTime variable’s BrowsePath assembles to /0:Objects/0:Server/0:ServerStatus/0:CurrentTime.Both approaches have their pros and cons. In general, the NodeId is less clumsy, but less descriptive. In this example, we prefer the NodeId and recreate the tree structure semantics with the help of MQTT mappings.
Below, there is a table of variables to use in the example. Most variables are read-only, except for the Temperature Setpoint, which allows us to actually control something.
|Variable             |NodeId                                      |BrowsePath                                                               |AccessLevel              |
|–––––––––––––––––––––|––––––––––––––––––––––––––––––––––––––––––––|–––––––––––––––––––––––––––––––––––––––––––––––––––––––––––––––––––––––––|–––––––––––––––––––––––––|
|CurrentTime          |i=2258                                      |/0:Objects/0:Server/0:ServerStatus/0:CurrentTime                         |CurrentRead              |
|Humidity             |ns=3;s=AirConditioner_1.Humidity            |/0:Objects/3:BuildingAutomation/3:AirConditioner_1/3:Humidity            |CurrentRead              |
|Power Consumption    |ns=3;s=AirConditioner_1.PowerConsumption    |/0:Objects/3:BuildingAutomation/3:AirConditioner_1/3:PowerConsumption    |CurrentRead              |
|Temperature          |ns=3;s=AirConditioner_1.Temperature         |/0:Objects/3:BuildingAutomation/3:AirConditioner_1/3:Temperature         |CurrentRead              |
|Temperature Setpoint |ns=3;s=AirConditioner_1.TemperatureSetPoint |/0:Objects/3:BuildingAutomation/3:AirConditioner_1/3:TemperatureSetPoint |CurrentRead, CurrentWrite|
Code-Sprache: YAML (yaml)The Service YAML is used to specify connections, endpoints and mappings for Connectware to handle. Create a new file in a text editor, e.g. opcua-example-service.yml. This example adds minimal content, to not distract the eye. For a complete reference of properties you can check out the Structure of the commissioning file.
These contain some general information. You can give a short description and add a stack of metadata. Regarding the metadata, only the name is required while the rest is optional. We will just use the following set of information for this lesson:
description: >
 OPC UA Example Service
 Cybus Knowledge Base - How to connect an OPC UA server

metadata:
 name: OPC UA Example Service
Code-Sprache: YAML (yaml)
Parameters can be adjusted in the Connectware Web UI. We are defining the address details of our OPC UA server as parameters, so they are used as default, but can be customized in case we want to connect to a different server.
parameters:

 opcuaHost:
   type: string
   description: OPC UA Host Address
   default: opcuaserver.com

 opcuaPort:
   type: integer
   description: OPC UA Host Port
   default: 48010
Code-Sprache: YAML (yaml)The first resource we need is a connection to the OPC UA server.
opcuaConnection:
   type: Cybus::Connection
   properties:
     protocol: Opcua
     connection:
       host: !ref opcuaHost
       port: !ref opcuaPort
       #username: myUsername
       #password: myPassword
Code-Sprache: YAML (yaml)
If you are using a username and password, you could also create parameters, to make them configurable. In our case the server does not require credentials.
  currentTime:
   type: Cybus::Endpoint
   properties:
     protocol: Opcua
     connection: !ref opcuaConnection
     topic: server/status/currenttime
     subscribe:
       nodeId: i=2258


 Humidity:
   type: Cybus::Endpoint
   properties:
     protocol: Opcua
     connection: !ref opcuaConnection
     topic: building-automation/airconditioner/1/humidity
     subscribe:
       nodeId: ns=3;s=AirConditioner_1.Humidity
       #browsePath: /0:Objects/3:BuildingAutomation/3:AirConditioner_1/3:Humidity

 PowerConsumption:
   type: Cybus::Endpoint
   properties:
     protocol: Opcua
     connection: !ref opcuaConnection
     topic: building-automation/airconditioner/1/power-consumption
     subscribe:
       nodeId: ns=3;s=AirConditioner_1.PowerConsumption

 Temperature:
   type: Cybus::Endpoint
   properties:
     protocol: Opcua
     connection: !ref opcuaConnection
     topic: building-automation/airconditioner/1/temperature
     subscribe:
       nodeId: ns=3;s=AirConditioner_1.Temperature

 TemperatureSetpointSub:
   type: Cybus::Endpoint
   properties:
     protocol: Opcua
     connection: !ref opcuaConnection
     topic: building-automation/airconditioner/1/temperature-setpoint
     subscribe:
       nodeId: ns=3;s=AirConditioner_1.TemperatureSetPoint


 TemperatureSetpointWrite:
   type: Cybus::Endpoint
   properties:
     protocol: Opcua
     connection: !ref opcuaConnection
     topic: building-automation/airconditioner/1/temperature-setpoint
     write:
       nodeId: ns=3;s=AirConditioner_1.TemperatureSetPoint
       #browsePath: /0:Objects/3:BuildingAutomation/3:AirConditioner_1/3:TemperatureSetPoint
Code-Sprache: YAML (yaml)
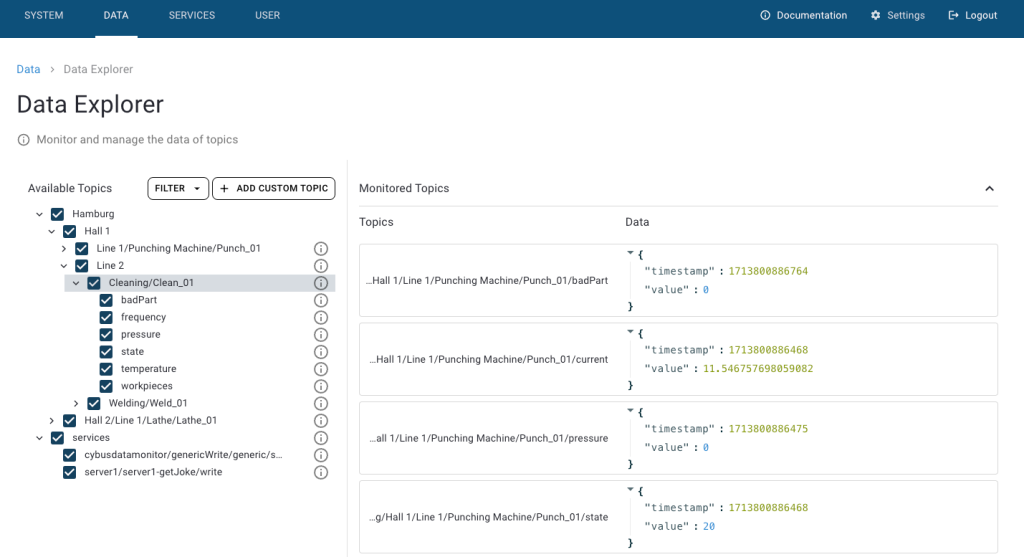
To see the incoming data, click Data on the navigation panel. In the Data Explorer list, you can see the MQTT topic we specified in the commissioning file. To see data from a specific topic/endpoint, navigate to the corresponding topic in Available Topics list. This makes Connectware subscribe to topic and display its values on the Monitored Topics. In the History section on the bottom right, you will find all the data received since you subscribed to the topics.
First, we used an OPC UA client application to browse the address space. This allowed us to pick the variables of our interest and to reference them by their NodeId, or by BrowsePath. Given that information, we created a Service YAML and installed the Service on Connectware. In the Explorer we finally saw the live data on corresponding MQTT topics and are now ready to go further with our OPC UA integration.
Why not store the OPC UA data in a time series database and display it on a dashboard for instance?
This lesson assumes that you want to integrate the Modbus/TCP protocol with Cybus Connectware. To understand the basic concepts of Connectware, please check out the Technical Overview lesson. To follow along with the example, you will also need a running instance of Connectware. If you don’t have that, learn How to install Connectware. Although we focus on Modbus/TCP here, we will ultimately access all data via MQTT. So you should also be familiar with MQTT. If in doubt, head over to our MQTT Basics lesson.
This article will teach you the integration of Modbus/TCP servers. In more detail, the following topics are covered:
The Commissioning Files used in this lesson are made available in the Example Files Repository on GitHub.
For this example we presume that we have a device of the type Janitza UMG 604-EP PRO installed on our Ethernet network. This is a device for measuring and analyzing the electric power quality, which is equipped with a Modbus/TCP server.
This device offers a lot of power analysis data you can access via Modbus, ranging over some thousands of address points. Although there is such a lot of interesting data, we assume that we just want to know the actual day of month, which is also provided and the real powers of L1-L3 as well as the utility frequency. Examining the Modbus address-list for UMG 604-PRO, we find the following addresses representing the date and time:
| Address | Format | Designation | Unit | Remarks                    |
|---------|--------|-------------|------|----------------------------|
| 0       | long64 | _REALTIME   | 2 ns | Time (UTC)                 |
| 4       | int    | _SYSTIME    | sec  | Time (UTC)                 |
| 6       | short  | _DAY        |      | Day (1 .. 31)              |
| 7       | short  | _MONTH      |      | Month (0=Jan, .. 11=Dec)   |
| 8       | short  | _YEAR       |      | Year                       |
| 9       | short  | _HOUR       | h    | Hour (1 .. 24)             |
| 10      | short  | _MIN        | min  | Minute (1 .. 59)           |
| 11      | short  | _SEC        | s    | Second (1 .. 59)           |
| 12      | short  | _WEEKDAY    |      | Weekday , (0=Sun .. 6=Sat) |
Code-Sprache: YAML (yaml)
We also find the following addresses representing frequently required readings:
| Address | Format | Designation   | Unit | Remarks                               |
|---------|--------|---------------|------|---------------------------------------|
| 19000   | float  | _G_ULN[0]     | V    | Voltage L1-N                          |
| 19002   | float  | _G_ULN[1]     | V    | Voltage L2-N                          |
| 19004   | float  | _G_ULN[2]     | V    | Voltage L3-N                          |
| 19006   | float  | _G_ULL[0]     | V    | Voltage L1-L2                         |
| 19008   | float  | _G_ULL[1]     | V    | Voltage L2-L3                         |
| 19010   | float  | _G_ULL[2]     | V    | Voltage L3-L1                         |
| 19012   | float  | _G_ILN[0]     | A    | Apparent current, L1-N                |
| 19014   | float  | _G_ILN[1]     | A    | Apparent current, L2-N                |
| 19016   | float  | _G_ILN[2]     | A    | Apparent current, L3-N                |
| 19018   | float  | _G_I_SUM3     | A    | Vector sum; IN=I1+I2+I3               |
| 19020   | float  | _G_PLN[0]     | W    | Real power L1-N                       |
| 19022   | float  | _G_PLN[1]     | W    | Real power L2-N                       |
| 19024   | float  | _G_PLN[2]     | W    | Real power L3-N                       |
| 19026   | float  | _G_P_SUM3     | W    | Psum3=P1+P2+P3                        |
| 19028   | float  | _G_SLN[0]     | VA   | Apparent power L1-N                   |
| 19030   | float  | _G_SLN[1]     | VA   | Apparent power L2-N                   |
| 19032   | float  | _G_SLN[2]     | VA   | Apparent power L3-N                   |
| 19034   | float  | _G_S_SUM3     | VA   | Sum; Ssum3=S1+S2+S3                   |
| 19036   | float  | _G_QLN[0]     | var  | Reactive power L1 (fundamental comp.) |
| 19038   | float  | _G_QLN[1]     | var  | Reactive power L2 (fundamental comp.) |
| 19040   | float  | _G_QLN[2]     | var  | Reactive power L3 (fundamental comp.) |
| 19042   | float  | _G_Q_SUM3     | var  | Qsum3=Q1+Q2+Q3 (fundamental comp.)    |
| 19044   | float  | _G_COS_PHI[0] | -    | CosPhi; UL1 IL1 (fundamental comp.)   |
| 19046   | float  | _G_COS_PHI[1] | -    | CosPhi; UL2 IL2 (fundamental comp.)   |
| 19048   | float  | _G_COS_PHI[2] | -    | CosPhi; UL3 IL3 (fundamental comp.)   |
| 19050   | float  | _G_FREQ       | Hz   | Measured frequency                    |
Code-Sprache: YAML (yaml)
In the documentation there is also a table defining the size and range of the terms used in the column Format, which we will need for specifying our endpoints.
| Type   | Size   | Minimum  | Maximum  |
|--------|--------|----------|----------|
| char   | 8 bit  | 0        | 255      |
| byte   | 8 bit  | -128     | 127      |
| short  | 16 bit | -2^15    | 2^15-1   |
| int    | 32 bit | -2^31    | 2^31-1   |
| uint   | 32 bit | 0        | 2^32-1   |
| long64 | 64 bit | -2^63    | 2^63-1   |
| float  | 32 bit | IEEE 754 | IEEE 754 |
| double | 64 bit | IEEE 754 | IEEE 754 |
Code-Sprache: YAML (yaml)The Commissioning File is a set of parameters which describes the resources that are necessary to collect and provide all the data for our application. It contains information about all connections, data endpoints and mappings and is read by Connectware. To understand the file’s anatomy in detail, please consult the Reference docs. To get started, open a text editor and create a new file, e.g. modbus-example-commissioning-file.yml. The Commissioning File is in the YAML format, perfectly readable for human and machine! We will now go through the process of defining the required sections for this example:
These sections contain more general information about the commissioning file. You can give a short description and add a stack of metadata. Regarding the metadata, only the name is required while the rest is optional. We will just use the following set of information for this lesson:
description: >

  Modbus/TCP Example Commissioning File
  Cybus Learn - How to connect and integrate an Modbus/TCP server
  https://learn.cybus.io/lessons/XXX/

metadata:

  name: Modbus/TCP Example Commissioning File
  version: 1.0.0
  icon: https://www.cybus.io/wp-content/uploads/2019/03/Cybus-logo-Claim-lang.svg
  provider: cybus
  homepage: https://www.cybus.io
Code-Sprache: YAML (yaml)
Parameters allow the user to customize Commissioning Files for multiple use cases by referring to them from within the Commissioning File. Each time a Commissioning File is applied or reconfigured in Connectware, the user is asked to enter custom values for the parameters or to confirm the default values.
parameters:

  modbusHost:
    type: string
    description: Modbus/TCP Host
    default: 192.168.123.123

  modbusPort:
    type: integer
    default: 502
Code-Sprache: YAML (yaml)
We are defining the host address details of our Modbus/TCP server as parameters, so they are used as default but can be customized in case we want to connect to a different server.
In the resources section we declare every resource that is needed for our application. The first resource we need is a connection to the Modbus/TCP server.
resources:

  modbusConnection:
    type: Cybus::Connection
    properties:
      protocol: Modbus
      connection:
        host: !ref modbusHost
        port: !ref modbusPort
Code-Sprache: YAML (yaml)
After giving our resource a name – for the connection it is modbusConnection – we define the type of the resource and its type-specific properties. In case of Cybus::Connection we declare which protocol and connection parameters we want to use. For details about the different resource types and available protocols, please consult the Reference docs. For the definition of our connection we reference the earlier declared parameters modbusHost and modbusPort by using !ref.
The next resources needed are the data points that we have selected earlier. Let’s add those by extending our list of resources with some endpoints.
  dayOfMonth:
    type: Cybus::Endpoint
    properties:
      protocol: Modbus
      connection: !ref modbusConnection
      subscribe:
        fc: 3
        length: 1
        interval: 2000
        address: 6
        dataType: int16BE

  realPowerL1:
    type: Cybus::Endpoint
    properties:
      protocol: Modbus
      connection: !ref modbusConnection
      subscribe:
        fc: 3
        length: 2
        interval: 2000
        address: 19020
        dataType: floatBE

  realPowerL2:
    type: Cybus::Endpoint
    properties:
      protocol: Modbus
      connection: !ref modbusConnection
      subscribe:
        fc: 3
        length: 2
        interval: 2000
        address: 19022
        dataType: floatBE

  realPowerL3:
    type: Cybus::Endpoint
    properties:
      protocol: Modbus
      connection: !ref modbusConnection
      subscribe:
        fc: 3
        length: 2
        interval: 2000
        address: 19024
        dataType: floatBE

  frequency:
    type: Cybus::Endpoint
    properties:
      protocol: Modbus
      connection: !ref modbusConnection
      subscribe:
        fc: 3
        length: 2
        interval: 2000
        address: 19050
        dataType: floatBE
Code-Sprache: YAML (yaml)
Each resource of the type Cybus::Endpoint needs a definition of the used protocol and on which connection it is rooted. Here you can easily refer to the previously declared connection by using its name. Furthermore we have to define which Modbus address the endpoint should read from or write to by giving the function code fc, the length , the interval, the address and the dataType.
The function code fc defines the operation of the request. To learn more about the different codes and their purpose, you can consult one of many sources on the web, e.g. Simply Modbus. However, the exact implementation of the function codes may vary from manufacturer to manufacturer and is in some sources described as „artistic freedom“ in designing their modbus devices. Which function code to use on which data is therefore also depending on your device and its structure of register addressing, so also check out the documentation of your device. For the device we utilize in this example, we can either use function code 3 or 4 to read the analogue values, so we just use 3.
The length describes how many registers should be read starting at the specified address. The registers of a modbus device have a length of 16 bits. Assuming we want to read the value of day of month, which is given in the format „short“, we learn from the table defining the actual size of the formats, it has a size of 16 bits and therefore a length of one register, so we define the property length as 1. For the other endpoints we define the length as 2, since the format „float“ is 32 bits long, using two registers.
Optionally, we can define the poll interval in milliseconds, defining how frequently a value is requested from the server, which is 1000 ms by default. To reduce the bandwidth demand we set the interval of our endpoints to 2000 ms.
We looked at the modbus address list of the device before and found the datapoints representing the day of month on address 6 and the readings of real power L1-L3 on addresses 19020,19022 and 19024 and the frequency on address 19050.
The property dataType is optional, but in fact you will get a buffer value in case you do not specify the data type explicitly, which at first you would have to parse yourself. To avoid this, we define the data types for the power values and frequency as floatBE, since from the address list we learned, those were in the format „float“ and the section „Byte sequence“ of this document gives us the information „The addresses described in this address list supply the data in the „Big-Endian“ format.“, which „BE“ stands for.
Looking at the endpoint „dayOfMonth“ we see, the format of its address is „short“, which corresponding to the table of formats matches the size and range of a 16-bit integer data type. Following this, we define the data type of the endpoint „dayOfMonth“ as int16BE. You can find all available data types for Modbus in the Reference docs.
To this point we are already able to read values from the Modbus/TCP server and monitor them in the Connectware Explorer or on the default MQTT topics related to our service. To achieve a data flow that would satisfy the requirements of our integration purpose, we may need to add a mapping resource to publish the data on topics corresponding to our MQTT topic structure.
  mapping:
    type: Cybus::Mapping
    properties:
      mappings:
        - subscribe:
            endpoint: !ref dayOfMonth
          publish:
            topic: 'janitza/status/day'
        - subscribe:
            endpoint: !ref realPowerL1
          publish:
            topic: 'janitza/measurement/realpower/1'
        - subscribe:
            endpoint: !ref realPowerL2
          publish:
            topic: 'janitza/measurement/realpower/2'
        - subscribe:
            endpoint: !ref realPowerL3
          publish:
            topic: 'janitza/measurement/realpower/3'
        - subscribe:
            endpoint: !ref frequency
          publish:
            topic: 'janitza/measurement/frequency'
Code-Sprache: YAML (yaml)
In this case the mapping defines which endpoints value is published on which MQTT topic. In case you want to perform a write operation to your device, you simply have to reverse the data flow and map it from the MQTT topic to the according endpoint like this:
  - subscribe:
      topic: 'janitza/control/setvalue'
    publish:
      endpoint: !ref valueToSetCode-Sprache: YAML (yaml)
Then you can write to the endpoint by simply publishing on this MQTT topic. Please note that write messages have to be in JSON format containing the value as follows:
{
  "value": true
}Code-Sprache: YAML (yaml)
This message has the obligatory key „value“, which can contain a value of any data type (which should match the concerning endpoint): For instance boolean values just use true/false, integers are represented by themselves like 3, decimals similarly appear as 10.45 and strings are written in "quotes".
You now have the Commissioning File ready for installation. Head over to the Services tab in the Connectware Admin UI and hit the (+) button to select upload the Commissioning File. You will be asked to specify values for each member of the section parameters or confirm the default values. With a proper written Commissioning File, the confirmation of this dialog will result in the installation of a Service, which manages all the resources we just defined: The connection to the Modbus/TCP server, the endpoints collecting data from the server and the mapping controlling where we can access this data. After enabling this Service you are good to go on and see if everything works out!
Now that we have a connection established between the Modbus/TCP server and Connectware, we can go to the Explorer view, where we see the tree structure of our newly created data points.
On MQTT topics the data is provided in JSON format containing a timestamp and a value key of which the value represents the data as received from the device:
{
  "value":"2020-07-14T11:43:06.632Z",
  "timestamp":1594726986632
}
Code-Sprache: YAML (yaml)Summarizing this lesson, at first we learned how to identify addresses of the desired data points in the address list of our device along with definitions and conventions about their representation. Given that information, we created a Commissioning File and installed the Service on Connectware. In the Explorer we finally saw the live data on corresponding MQTT topics and are now ready to go further with our Modbus integration.
Connectware offers powerful features to build and deploy applications for gathering, filtering, forwarding, monitoring, displaying, buffering, and all kinds of processing data… why not build a dashboard for instance? For guides check out more of Cybus Learn.
This article will be covering the MQTT Protocol including:
MQTT or Message Queuing Telemetry Transport is a lightweight publish (send a message) subscribe (wait for a message) protocol. It was designed to be used on networks that have low-bandwidth, high-latency and could be unreliable. Since it was designed with these constraints in mind, it’s perfect to send data between devices and is very common in the IoT world.
MQTT was invented by Dr Andy Stanford-Clark of IBM, and Arlen Nipper of Arcom (now Eurotech), in 1999. They invented the protocol while working on the SCADA system for an oil and gas company that needed to deliver real time data. For 10 years, IBM used the protocol internally. Then, in 2010 they released MQTT 3.1 as a free version for public use. Since then many companies have used the protocol including Cybus.
If you’re interested in learning more you can click here to read the transcript of an IBM podcast where the creators discuss the history and use of MQTT.
A client is defined as any device from a microcontroller to a server as long as it runs a MQTT client library and connects to a MQTT broker over a network. You will find that many small devices that need to connect over the network use MQTT and you will find that there are a huge number of programming languages that support MQTT as well.
Find a list of libraries here.
The broker is defined as the connector of all clients that publish and receive data. It manages active connections, filtering of messages, receiving messages and then routing messages to the correct clients. Optionally, it can also handle the authentication and authorization of clients.
Find a list of brokers here.
For information on how they work together continue on to the next section.
MQTT uses the publish (send a message) subscribe (wait for a message) pattern. This is an alternative approach to how a normal client (asks for data) server (send back data) pattern works. In the client server pattern, a client will connect directly to a component for requesting data and then immediately receive a response back. In the publish subscribe pattern, the connection between the components is handled by a third party component called a broker.
All messages go through the broker and it handles dispatching the correct message to correct receivers. It does that through the use of a topic. A topic is a simple string that can have hierarchical levels separated by ‚/‘.
Examples topics:
The MQTT client can listen for a message by subscribing to a specific topic. It will then receive data when a MQTT client publishes a message on that topic.
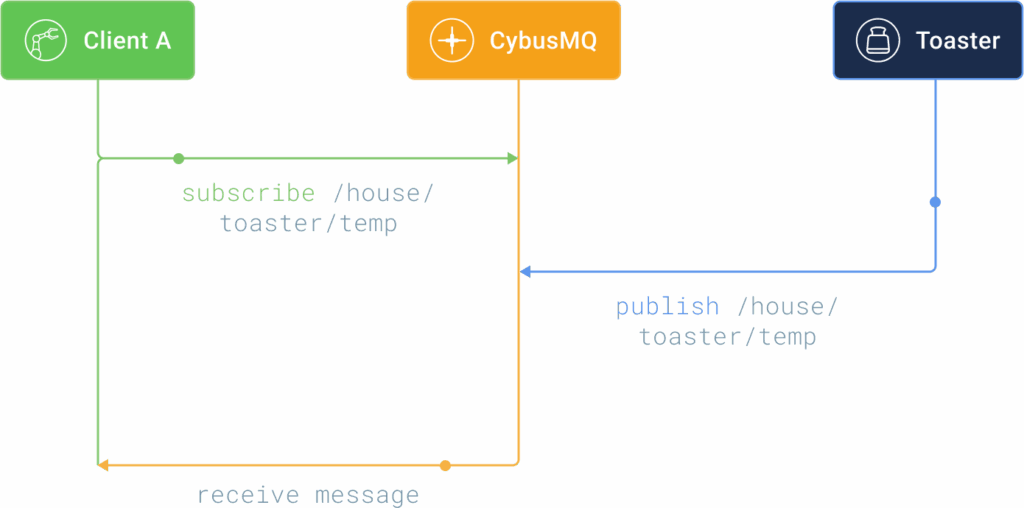
This publish subscribe pattern offers a couple of advantages:
Topics are the way that data is organized in MQTT. They are structured in a hierarchy manner using the ‚/‘ as a separator. It’s very similar to how folders and files are structured in a file system. A few things to remember about topics are that they are case sensitive, must use UTF-8 and have to have at least 1 character.
A client can also subscribe to multiple topics at once using wildcards. The 2 wildcards in MQTT are:
The level being the level of the topic hierarchy tree that you want to subscribe to.
Subscribe to house/#
The ‘#’ wildcard gets all the information under the topic ‘house’.
Subscribe to house/+/light
NOT
The ‘+’ wildcard gets all the topics that has ‘light’ as a keyword.
An MQTT client can only publish to an individual topic. Meaning you cannot use wildcards.
The only topics you will find in a broker after start is the $SYS topics. These topics are usually reserved for publishing internal statistics about the broker such as the number of current client connections.
If you would like to read more specifics on the requirements of topics see the MQTT specification.
QOS (Quality of Service) is defined as the agreement between the broker and the client that deals with the guarantee that a message was delivered. MQTT defines 3 levels of QOS.
This is the fastest QOS level(works as “fire and forget”). When a message is sent across the network no reply from the broker is sent acknowledging that it received the message. The sending message is then deleted from the client sending queue so no repeat messages will be sent.
This level is the default mode of transfer. The message is guaranteed to be delivered at least once. It will continue to send the message with a DUP flag until an acknowledgment message is sent. This could result in duplicate messages being sent.
This is the slowest level as it requires 4 messages. The message is always delivered exactly once.
Normally when a client publishes a message to the broker, the broker will delete the message after routing to the correct subscribing clients. But what if a client subscribes to a topic after the message is sent? Then it will receive no data until another message is published. This could be desirable in certain situations but in other situations you may want the client to have the last published data. This is the purpose of the retain flag. If set to true when a message is sent the broker will cache the message and route it to any new subscribing clients. There is only 1 retained message per topic and if a new message is published it will replace the retained message.
MQTT is a lightweight publish subscribe protocol. It is defined with a broker client relationship and organizes its data in hierarchy structures called topics. When publishing messages you can specify a QOS level which will guarantee that a message is sent and specify a retain level for a message so a subscribing client can receive retained data after connecting.
Sie müssen den Inhalt von reCAPTCHA laden, um das Formular abzuschicken. Bitte beachten Sie, dass dabei Daten mit Drittanbietern ausgetauscht werden.
Mehr InformationenSie sehen gerade einen Platzhalterinhalt von Facebook. Um auf den eigentlichen Inhalt zuzugreifen, klicken Sie auf die Schaltfläche unten. Bitte beachten Sie, dass dabei Daten an Drittanbieter weitergegeben werden.
Mehr InformationenSie sehen gerade einen Platzhalterinhalt von Instagram. Um auf den eigentlichen Inhalt zuzugreifen, klicken Sie auf die Schaltfläche unten. Bitte beachten Sie, dass dabei Daten an Drittanbieter weitergegeben werden.
Mehr InformationenSie sehen gerade einen Platzhalterinhalt von X. Um auf den eigentlichen Inhalt zuzugreifen, klicken Sie auf die Schaltfläche unten. Bitte beachten Sie, dass dabei Daten an Drittanbieter weitergegeben werden.
Mehr Informationen