Product | 07.10.2026
Operators can see the health of their data foundation at any time, through the monitoring tools they already use.
Cybus Connectware runs where downtime is not an option – inside the production environments of the world’s most demanding manufacturers. Release 2.6 makes that foundation even stronger: it now exposes native Prometheus metrics across all key components, giving operators deeper, real-time insight into connections, data flow and performance – in the stack they already use.
| Component | What you can now see |
|---|---|
| Protocol Mapper Agent | Are my machines connected? Is data flowing through endpoints and mappings? |
| Service Manager | Are my services running? Did deployments succeed? |
| Resource Status Tracking | Is the system in the state it should be? Are there service deviations I have not noticed? |
| Auth Server | Are authentication and authorization working? Are there access failures or spikes happening right now? |
See the monitoring documentation for setup and configuration, and the metrics reference for every metric each component exposes.
This is an example of what your team could see. Your Grafana dashboard, reading from your own Prometheus: Connectware supplies the metrics, your team builds whatever dashboard it needs.
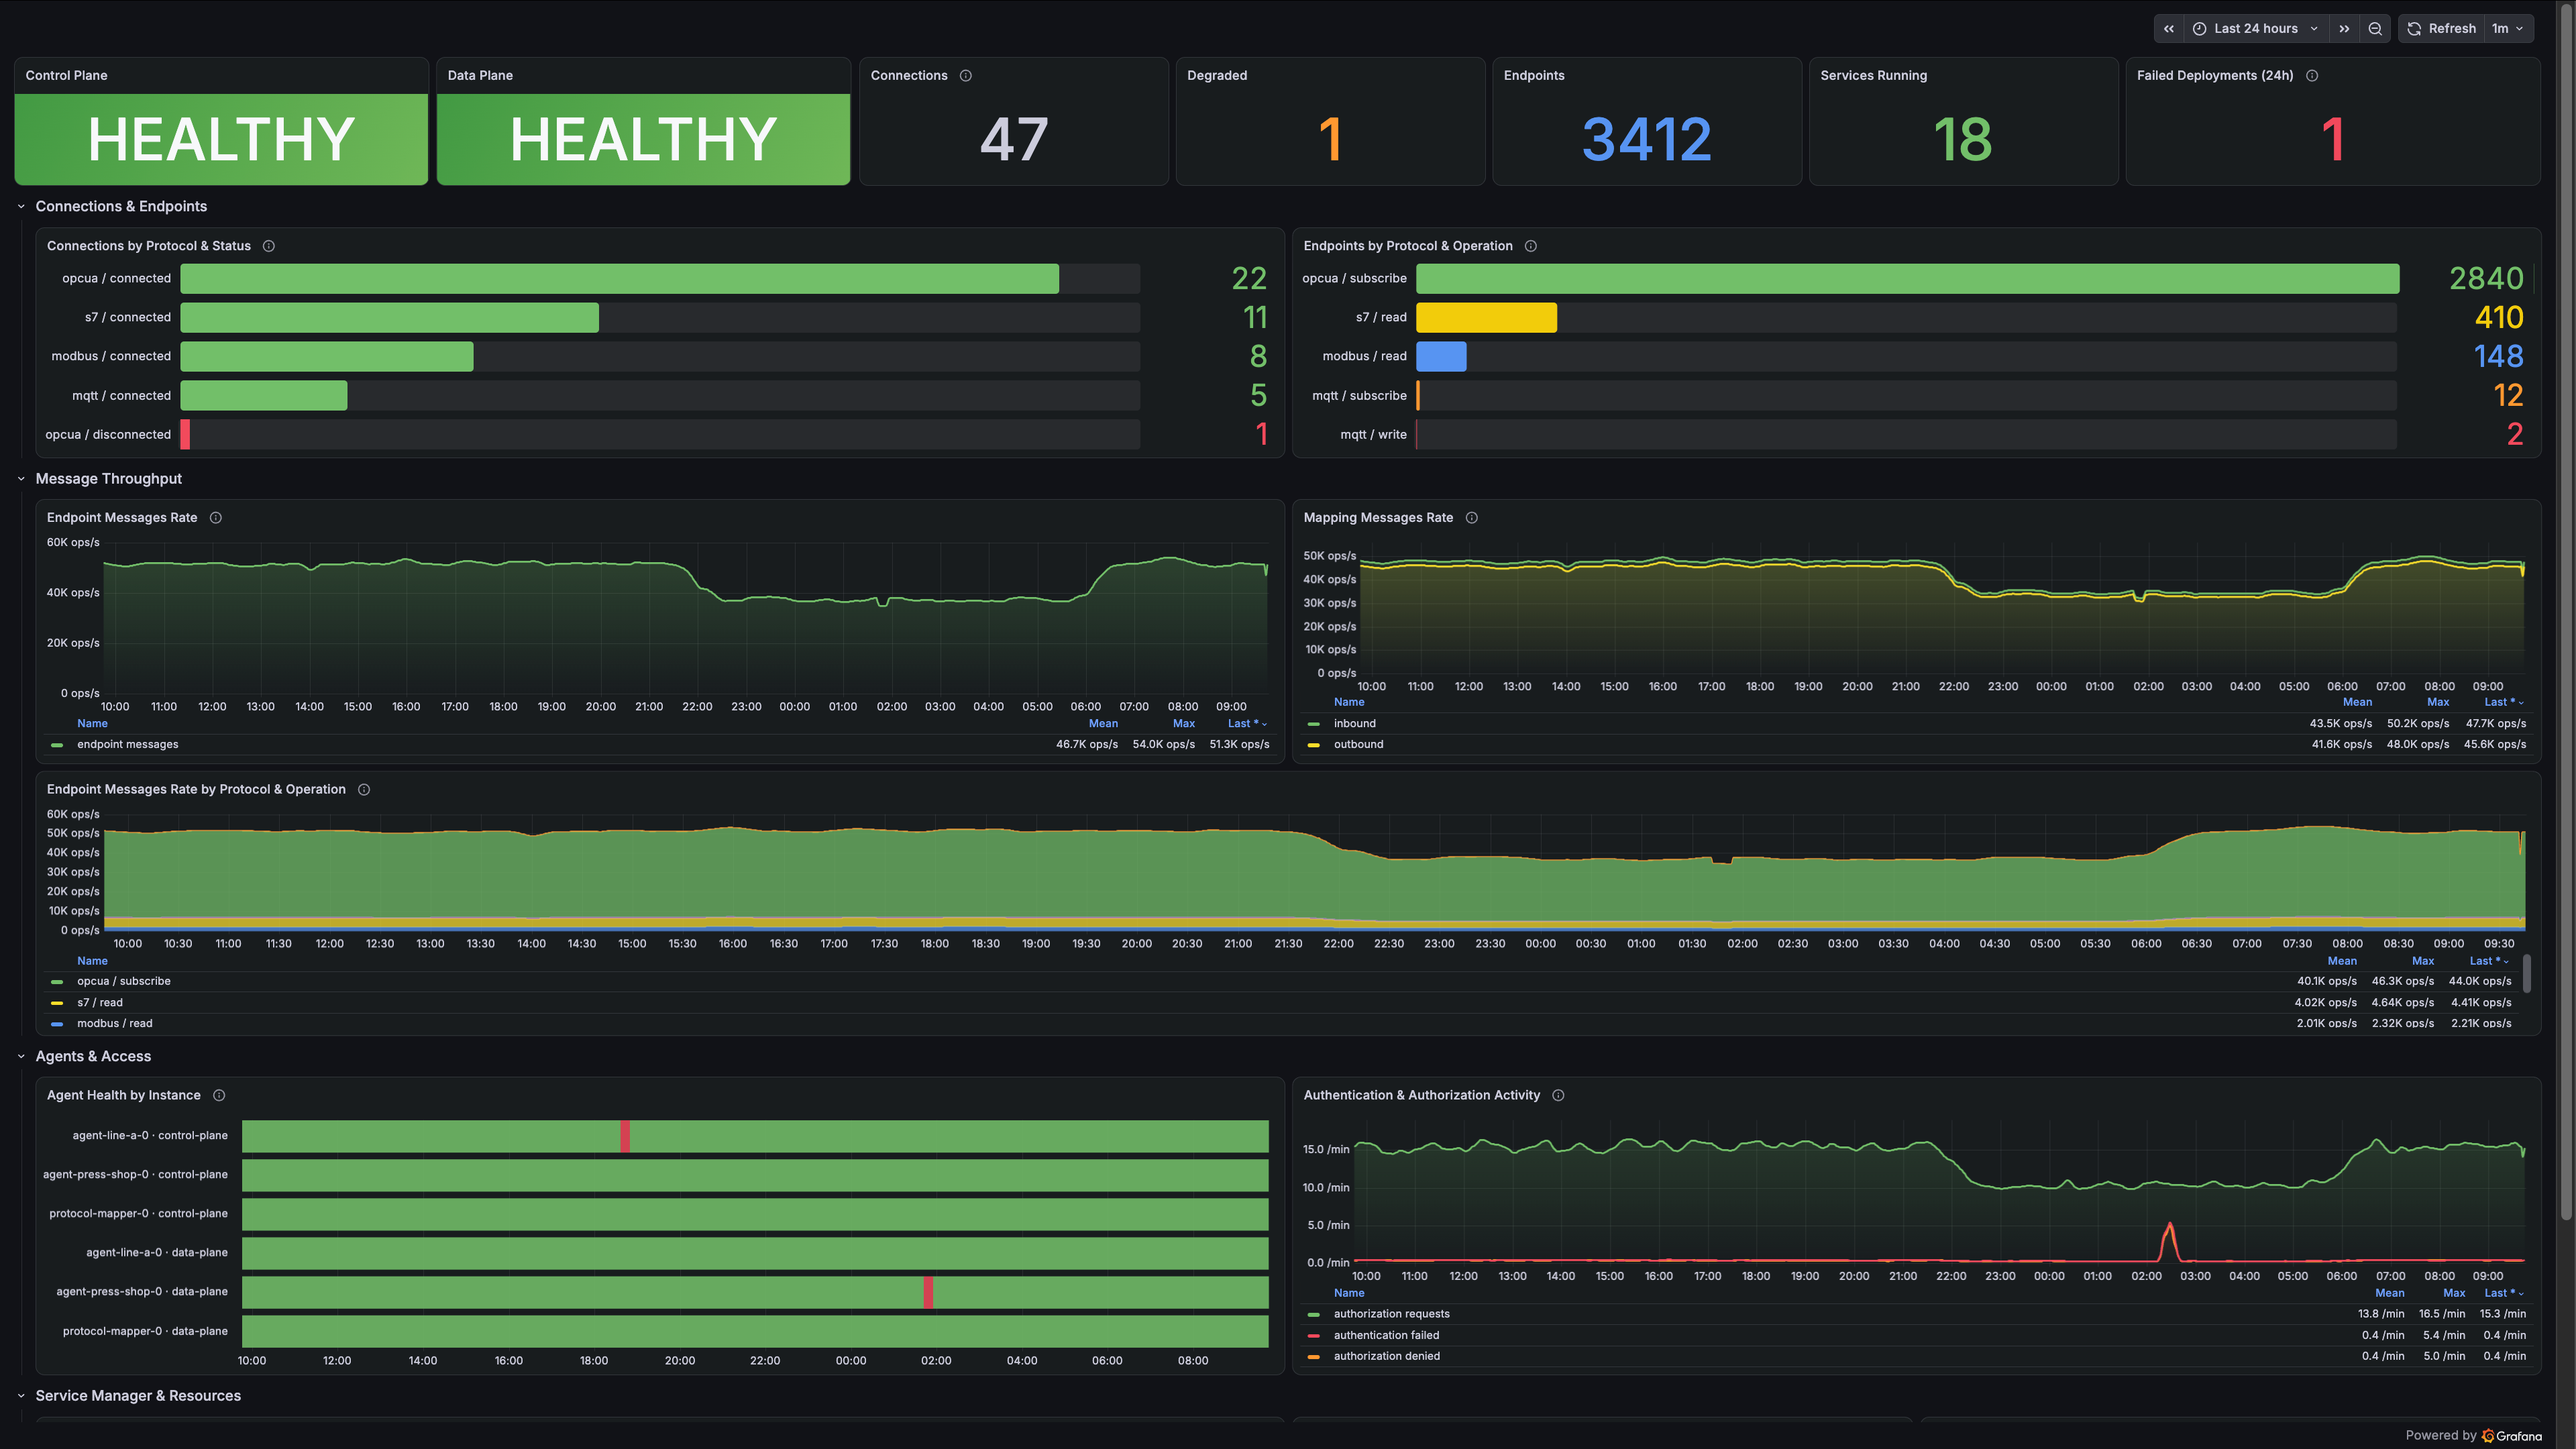
For example in this dashboard: Everything green except four things: one OPC UA connection down, one failed deployment, two agents that dropped out briefly, one spike in denied access. Four problems in 3,412 endpoints. Visible right away.
Cybus Connectware is the infrastructure production runs on – proven in the most demanding environments. Release 2.6 makes it easier to operate at scale: teams running Cybus Connectware inside a shared enterprise monitoring stack now integrate it directly, catch events earlier and pinpoint their source with precision. They do it from the dashboards and alert rules they already maintain, not from a separate tool. This is observability at the level enterprise teams expect – one more step in making a strong data foundation easier to operate and to scale.
Available from Release 2.6. The metrics are active after the upgrade, with automatic discovery on Kubernetes. The complete 2.6 changelog is also available.
Stay in the loop: subscribe to the Software Update newsletter. Found a bug or have feedback? Contact us.
You need to load content from reCAPTCHA to submit the form. Please note that doing so will share data with third-party providers.
More InformationYou are currently viewing a placeholder content from Turnstile. To access the actual content, click the button below. Please note that doing so will share data with third-party providers.
More InformationYou are currently viewing a placeholder content from Facebook. To access the actual content, click the button below. Please note that doing so will share data with third-party providers.
More InformationYou are currently viewing a placeholder content from Hubspot Embedded Content. To access the actual content, click the button below. Please note that doing so will share data with third-party providers.
More InformationYou are currently viewing a placeholder content from HubSpot. To access the actual content, click the button below. Please note that doing so will share data with third-party providers.
More InformationYou are currently viewing a placeholder content from Hubspot Meetings. To access the actual content, click the button below. Please note that doing so will share data with third-party providers.
More InformationYou are currently viewing a placeholder content from Instagram. To access the actual content, click the button below. Please note that doing so will share data with third-party providers.
More InformationYou are currently viewing a placeholder content from reCAPTCHA. To access the actual content, click the button below. Please note that doing so will share data with third-party providers.
More InformationYou are currently viewing a placeholder content from X. To access the actual content, click the button below. Please note that doing so will share data with third-party providers.
More Information